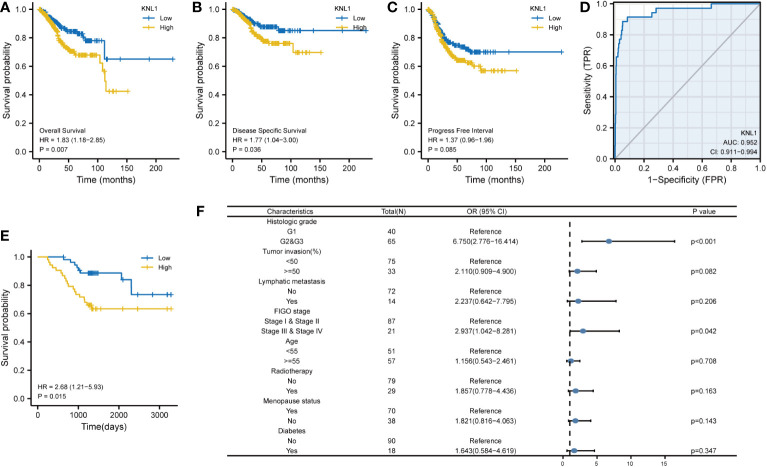
Figure 7.
Correlation of KNL1 expression with the outcomes of UCEC patients. (A–C) KM survival curves stratified by KNL1 expression for overall survival (OS), disease-specific survival (DSS), and progression-free interval (PFI). (D) Prognostic ROC curve; the area under the ROC curve was between 0.5 and 1. The closer the AUC is to 1, the better the diagnostic effect is. The AUC has a low accuracy when it is between 0.5 and 0.7, a moderate accuracy when it is between 0.7 and 0.9, and a high accuracy when it is above 0.9. (E) KM OS curves stratified by KNL1 expression of 108 clinical samples of UCEC. (F) Results of binary logistic regression analysis of the correlation between the KNL1 expression level and the clinical characteristics of the 108 patients. The data were incomplete, as some records were lost.

