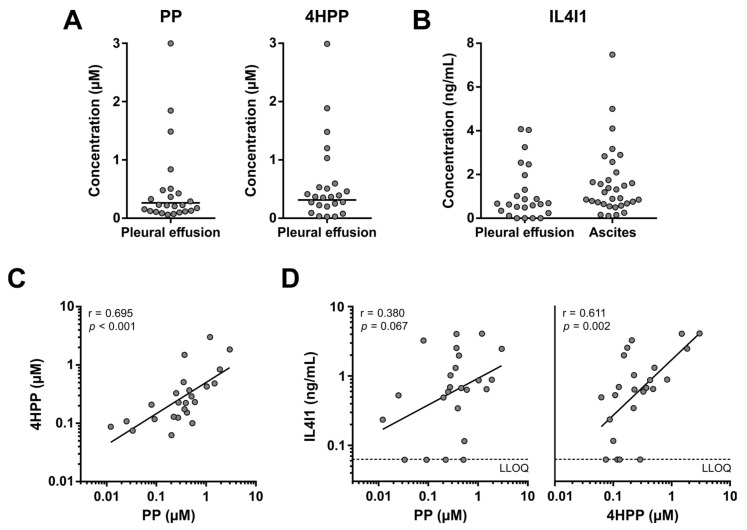
Figure 7.
PP, 4HPP and IL4I1 levels in pleural effusion samples of patients with stage IV non-small cell lung cancer. (A) PP and 4HPP levels in pleural effusion samples (n = 24). Horizontal lines indicate geometric means. (B) IL4I1 levels in pleural effusion of non-small cell lung cancer patients (n = 24) and ascites of high-grade serous ovarian cancer patients (n = 32). IL4I1 levels in four pleural effusion samples were below the lower limit of quantification (LLOQ). Geometric means are therefore not displayed. (C,D) Correlation between PP, 4HPP and IL4I1 levels in pleural effusion samples. Dashed lines indicate the LLOQ. Samples with an IL4I1 level below the LLOQ are shown at the LLOQ value. Results of Pearson’s correlation analyses are indicated in the graphs. 4HPP: 4-hydroxyphenylpyruvic acid; IL4I1: interleukin 4 induced 1; PP: phenylpyruvic acid; r: Pearson’s correlation rank coefficient.

