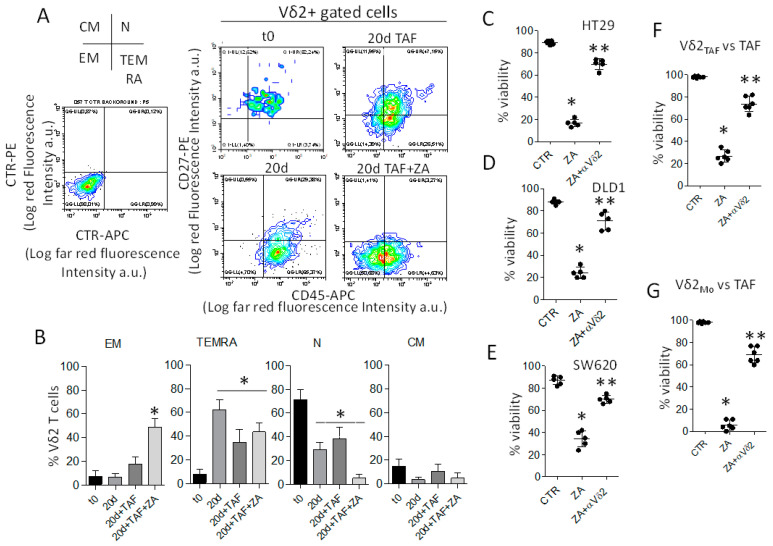
Figure 2.
ZA induces CRC-TAF to stimulate the expansion of anti-tumor effector Vδ2 T lymphocytes. (A): Phenotype of Vδ2 T cells (one representative experiment) expanded on untreated or ZA-treated (1.2 µM) CRC-TAF (16-030) on day 20. Samples were labelled with anti-Vδ2, anti-CD27 and anti-CD45RA mAbs gated on Vδ2 T cells and results are expressed as Log far red fluorescence intensity vs. Log red fluorescence intensity. The cross depicted on the left identifies the quadrants showing effector memory (EM, lower left, double negative), terminally-differentiated effector memory (TEMRA, lower right CD45RA+ CD27−), naive (N, upper right, double positive) and central memory (CM, upper left, CD45RA− and CD27+) cells. (B): Analysis of the phenotype of Vδ2 T cells obtained as in A, using T lymphocytes from three healthy donors (#45, #46, #47) co-cultured with six CRC-TAF (016-001, 16-004, 16-030, 16-035, 16-039, 16-047). Results are expressed as percentage of EM, TEMRA, N and CM cells gated on Vδ2 T cells; the mean ± SD from 18 experiments is shown. (C–E): Activated Vδ2 T cells obtained as in A from five healthy donors were tested in a cytotoxicity assay vs. the CRC cell lines HT29 (C) and DLD1 (D) (EGFR+) or SW620 ((E), EGFRdull) at the E:T ratio of 10:1, without (CTR) or with soluble ZA (1.2 µM). In some samples, the anti-Vδ2 TCR mAb was added. Results are expressed as percentage of viability evaluated by crystal-violet assay. (F,G): Activated Vδ2 T lymphocytes from two healthy donors obtained with ZA-activated CRC-TAF (Vδ2 TAF) or monocytes (Vδ2Mo) were employed as effectors against CRC-TAF (n = 3, 016-001, 16-004, 16-030) as targets at the E:T ratio of 10:1, as above. Cytotoxicity was detected as in panels (C–E), and referred to as percent of viability. * p < 0.001 ZA vs. CTR and ** p < 0.001 ZA + αVδ2 vs. ZA.

