Figure 5.
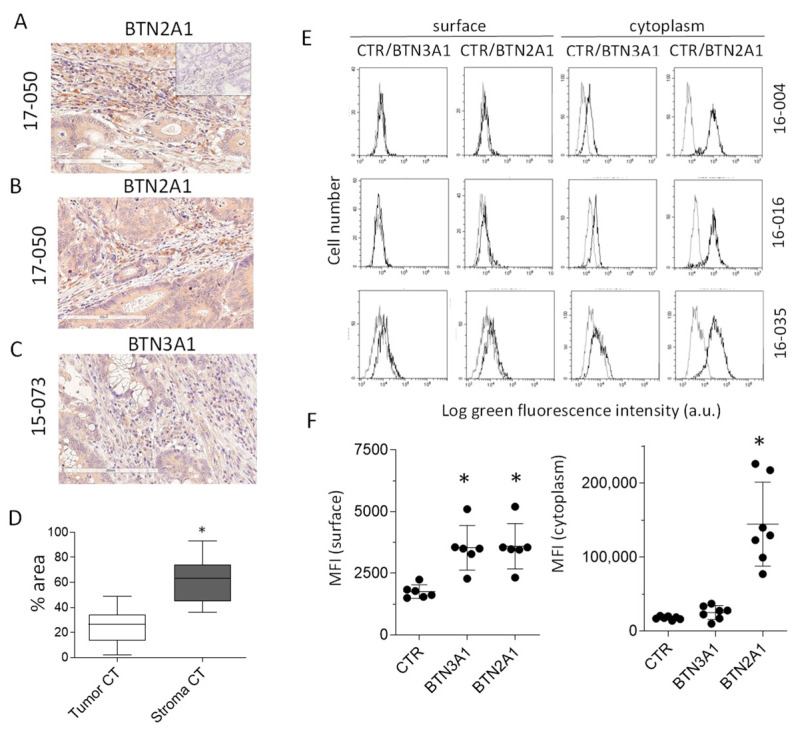
Expression of butyrophilins on tumor stroma and cultured CRC-TAF. (A–C): Sections of the CRC 17-050 or 15-073 were stained with the rabbit anti-BTN2A1 (two fields of 17-050 in (A,B)) or the rabbit anti-BTN3A1 (15-073, (C)) antisera respectively. Digital images (20×) were captured using the Aperio AT2 scanner. Negative control in the inset of A. (D): Samples acquired as in (A–C) were analyzed with the pattern recognition tool of the Genie Classifier software and the percentage area of each compartment (tumor vs. stroma) was calculated specifically in the central tumor. The results are the mean ± SD from 6 different CRC specimens, each analyzed in 4 slide areas. * p < 0.001. (E) Left: CRC-TAF (16-004,16-016,16-035) were surface stained with the anti-BTN2A1 or the anti-BTN3A1 antisera, followed by FITC-anti-rabbit antiserum. (E) Right: the same samples were fixed and permeabilized before staining. Samples were analyzed by flow cytometry and results expressed as the Log green fluorescence intensity vs. number of cells (MFI, arbitrary units, a.u.). Grey histograms: negative control (CTR); black histograms: BTN2A1 or BTN3A1. (F): MFI of BTN3A1 and BTN2A1 in six CRC-TAF stained at the surface (left) or in the cytoplasm (right). Mean ± SD of the six cases; * p < 0.001.

