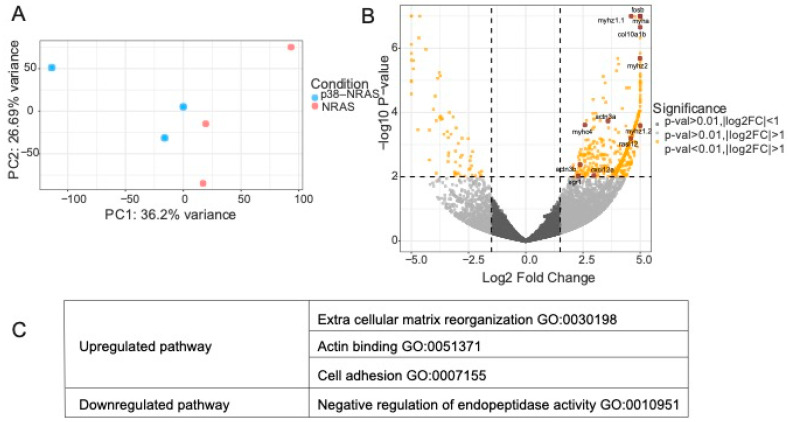
Figure 8.
RNA sequencing analysis of p38–NRASQ61K-and NRASQ61K-derived zebrafish tumor tissues. (A): Principal component analysis of p38–NRASQ61K tumors compared with NRASQ61K tumors (normalized + log2). (B): Volcano plot showing differentially expressed genes (DEGs) in p38–NRASQ61K tumors compared with NRASQ61K tumors (raw threshold; 0.01). Most upregulated and downregulated pathway by over-representation analysis (ORA, p-value < 0.01). (C): Most upregulated and downregulated pathways in tumors derived from p38– NRASQ61K compared to NRASQ61K as represented by ORA, p-value < 0.05.

