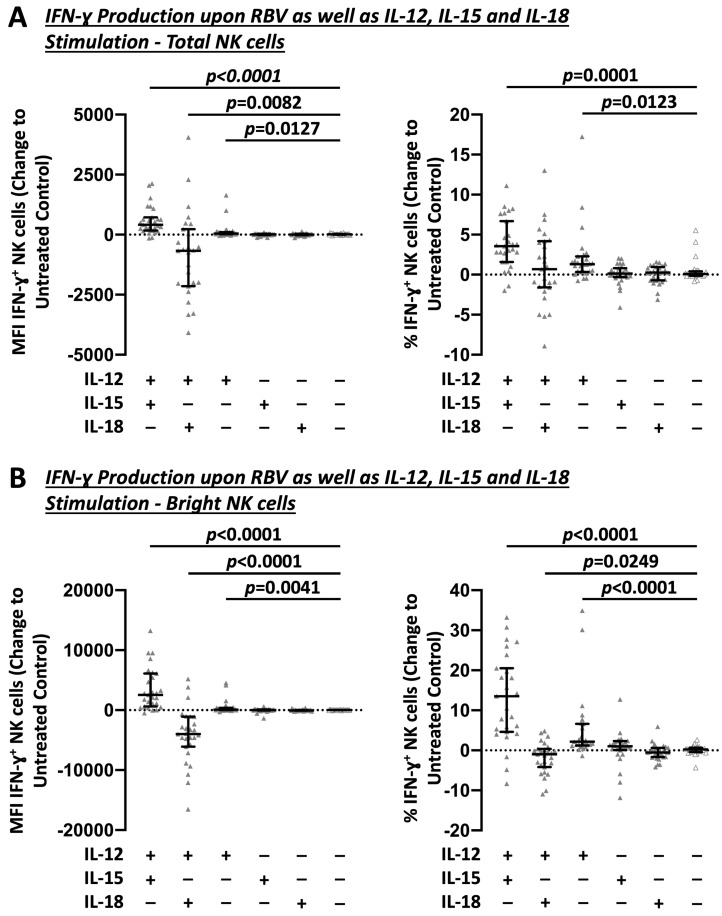
Figure 4.
Impact of different sole and combined IL stimulations on RBV-treated NK cells. Flow cytometric analysis of IFN-γ production as change to untreated controls. MFI and frequencies compared. (A) Total NK cells. (B) Bright NK cells (n = 27). Appearance: median with interquartile range, statistical analysis: Wilcoxon matched-pairs signed-rank test.

