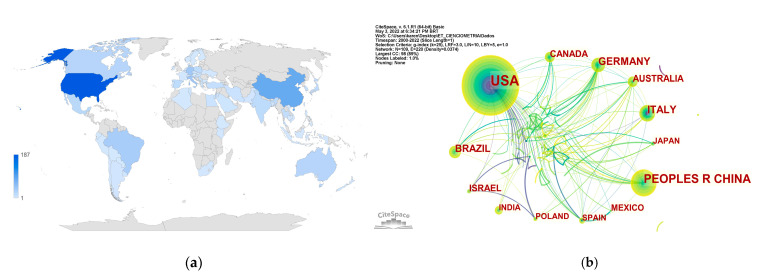
Figure 4.
Geolocation of the 604 studies included in the review. (a) The geographic distribution of the studies is related to the color of each country, proportional to the number of publications (for interpretation purposes, the scale range from light blue which presents countries with the lowest number of publications to dark blue which presents countries with the highest number of publications, and gray which presents countries no publication). (b) The co-occurrence network of the nations is related by the node’s size, determined by the number of times that word was used and the links in the relationship between the countries.

