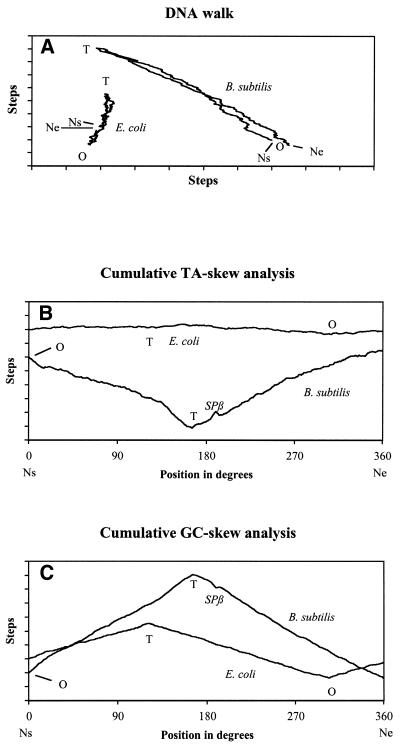
Figure 1.
Genometric characterizations of B.subtilis and E.coli. Bacillus subtilis and E.coli chromosomes comprise 4 214 814 and 4 639 221 bp, respectively. For a given chromosome, Ns and Ne refer to the nucleotides at the start and the end of the sequence, respectively. O and T correspond to the experimentally determined origin and terminus of chromosome replication (15,17). SPβ is an integrated prophage of B.subtilis of 134 416 nt (16). One division on the step scale corresponds to 10 000 steps (16). For both chromosomes, positions are indicated in degrees. (A) DNA walk: processing of a given genome, nucleotide by nucleotide, generates the displayed paths which measure the internal deviation of pairing nucleotides. Reading of one nucleotide, i.e. G, T, C and A, corresponds to one step towards north, east, south and west, respectively. Escherichia coli and B.subtilis are examples of organisms presenting a path with a positive and a negative slope, respectively. (B) Cumulative TA-skew graph is obtained by replacing G by T and C by A in the GC-skew description. In E.coli, the origin and the terminus of DNA replication correspond to the minimum and the maximum of the curve, respectively, while in B.subtilis, the reverse is true. (C) Cumulative GC-skew graph: the algorithm is similar to a DNA walk. A step eastwards is assigned to each nucleotide, while for a G or a C, a concomitant step to the north or the south, respectively, is performed. Whenever available, experimental evidence reveal that, for both bacteria, the origin and the terminus of chromosome replication correspond to the minimum and the maximum of the cumulative GC-skew graphs, respectively.

