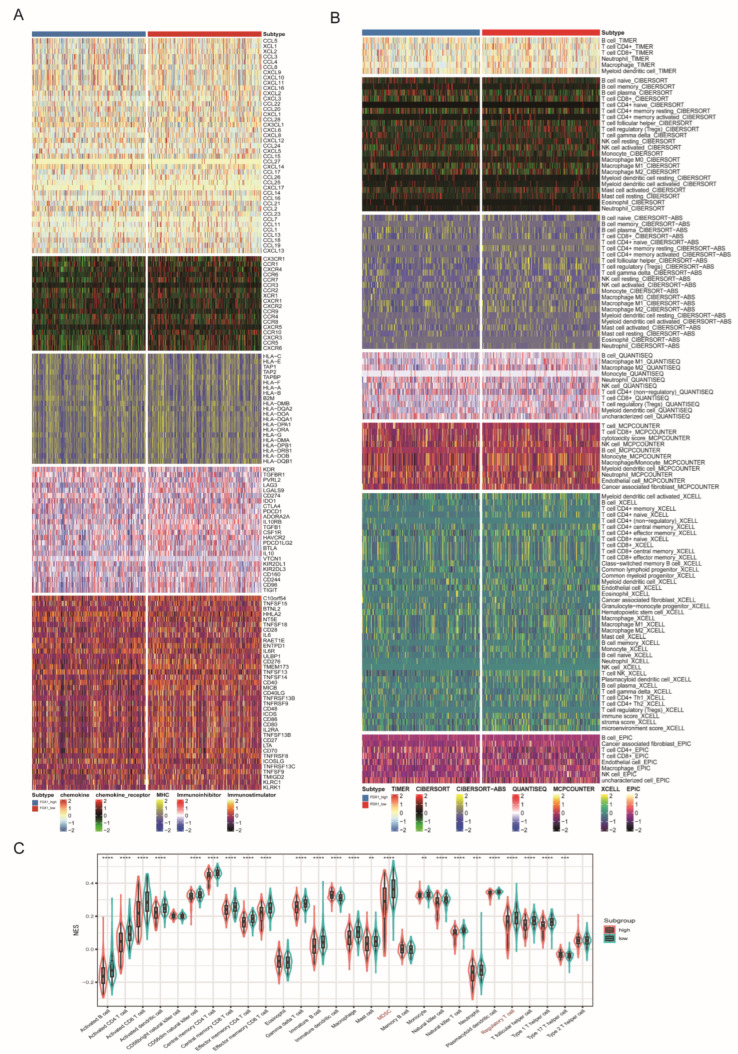
Figure 7.
Immune profiling between FDX1high and FDX1low subtypes. (A) Heatmap of immune-related genes between subtypes, including chemokine, chemokine receptor, MHC, immunoinhibitory, and immunostimulatory. (B) Heatmap of tumor-related infiltrating immune cells according to immune cell quantity algorithms. (C) Boxplot of immune cell infiltration based on the ssGSEA algorithm. ** p < 0.01, *** p < 0.001, **** p < 0.0001.

