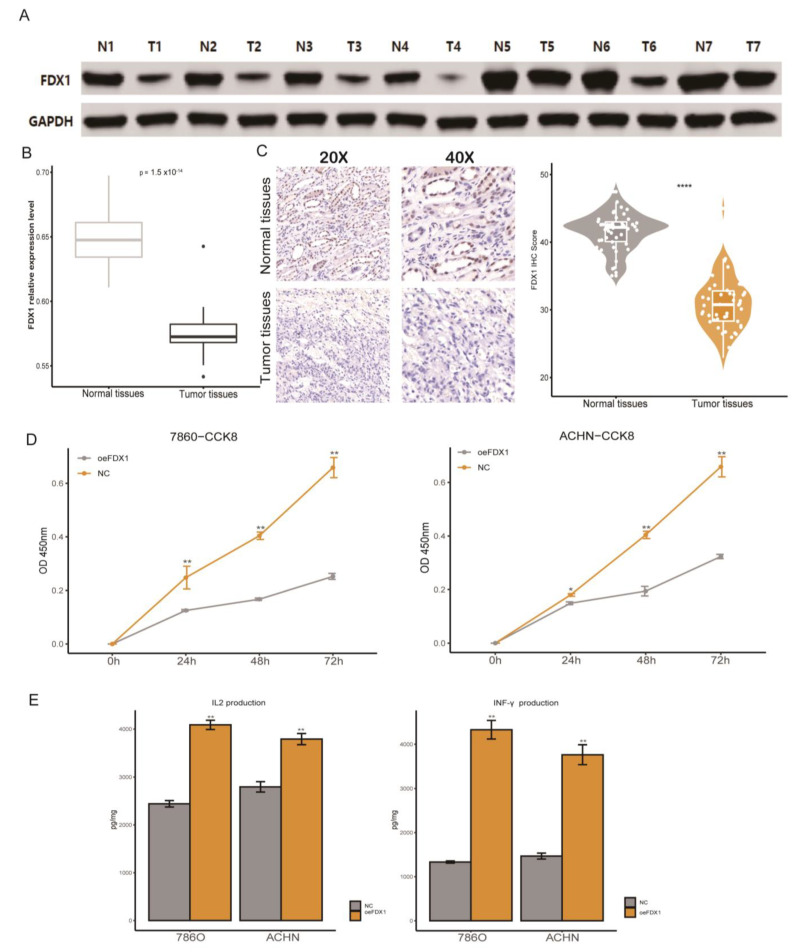
Figure 11.
Verification of FDX1′s aberrant expression and immune impact on ccRCC. (A) Western blotting validated the FDX1 expression level in ccRCC. (B) RT-qPCR results of FDX1 expression levels in normal and tumor tissues. (C) Representative immunohistochemical images of FDX1 from the Changhai ccRCC cohorts. (D) Cell proliferation of 786-O and ACHN cells in the NC and FDX1-overexpressing cell lines. (E) The IL-2 and IFN-γ protein levels in the coculture medium were measured by ELISA after coincubation. * p < 0.05, ** p < 0.01, **** p < 0.0001.

