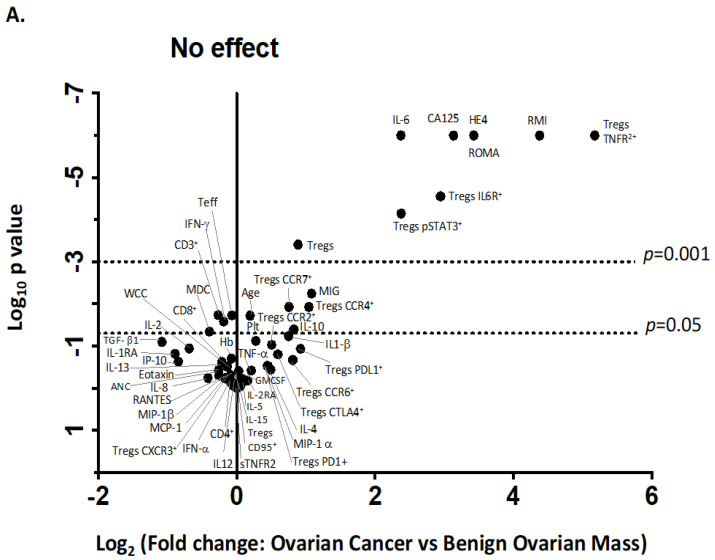
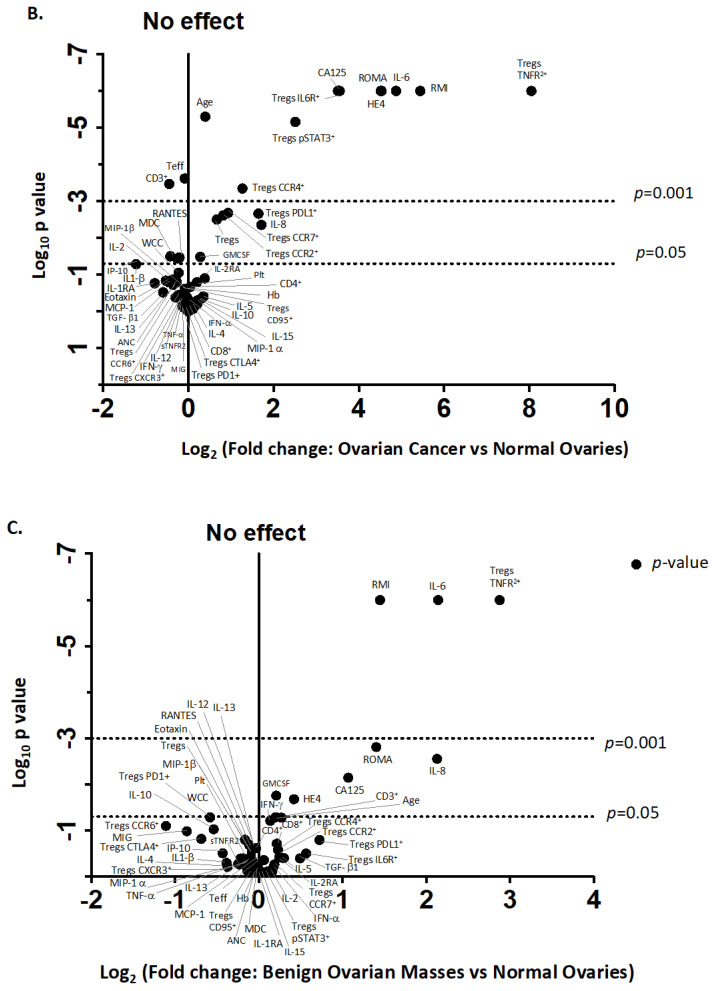
Figure 3.
Volcano plot for the identification of discriminating biomarkers. Pre-treatment blood was withdrawn from 33 patients with ovarian cancer, 12 with benign ovarian mass and 21 with normal ovaries. A total of 28 serum-soluble factors measured using multiplex bead immunoassay and 16 phenotypic markers on Tregs and Teff quantified by flow cytometry as well as demographic data, blood components, serum CA125 and HE4 were included in analysis. Each circle corresponds to one study factor. The figure represents the negative log10 p-values plotted against the log2-fold change of study factors, namely, the difference between two groups: (A) cancer versus benign ovarian mass, (B) cancer versus normal ovaries and (C) benign versus normal ovaries. Study factors with contrasts greater than a 2-fold change or with a p-value < 0.05 are labelled.


