Figure 6.
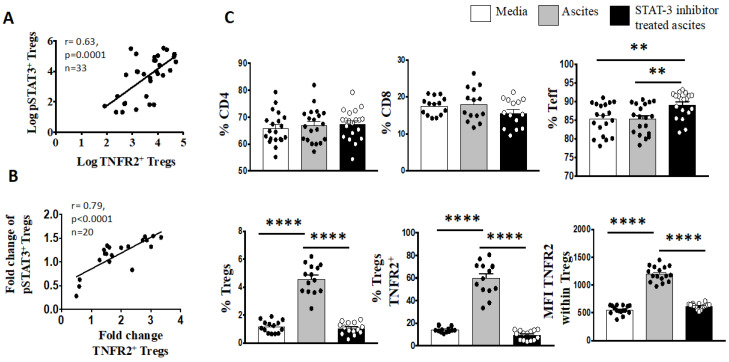
Blockade of pY705-STAT3 signaling decreases percentage of Tregs, as well as TNFR2+ Tregs and TNFR2 expression. (A) Peripheral blood mononuclear cells (PBMCs) from patients with advanced HGSOC (n = 33) were isolated by Ficoll density centrifugation and freshly stained for surface and intracellular markers CD3, CD4, CD25, TNFR2, FoxP3 and pSTAT3 and analysed with flow cytometry. (B,C) PBMCs from healthy donors (n = 20) were isolated by Ficoll density centrifugation and incubated in vitro in media or cell-free ascites from advanced EOC patients for 48 h. pY705-STAT3 activity was inhibited by the addition of 50 μM S3I-201 into the culture at day 0. In untreated media and ascites, vehicle control DMSO at 0.05% was added at day 0. Cells were washed, labeled for surface and intracellular markers CD3, CD4, CD25, TNFR2, FoxP3 and pSTAT3, and analysed with flow cytometry. (A,B) Correlation of the percentage of pSTAT3+ Tregs to TNFR2+ Tregs (log) in patients with advanced HGSOC. B. Correlation of the fold change of pSTAT3+ Tregs to TNFR2+ Tregs in healthy donors PBMC following incubation in ascites of EOC patient, p < 0.05 is significant. (C) The frequency (%) of CD4, CD8, Teff and Tregs as well as the percentage of TNFR2 and level of TNFR2 expression (median fluorescence intensity, MFI) within Tregs within media (white bar), ascites (grey bar) and following blockade with STAT3 inhibitor (black bar). ** p = 0.001–0.01, **** p < 0.0001—one-way ANOVA and Dunn’s multiple comparison test (post-hoc). Data are pooled from two independent experiments (error bars—SEM).

