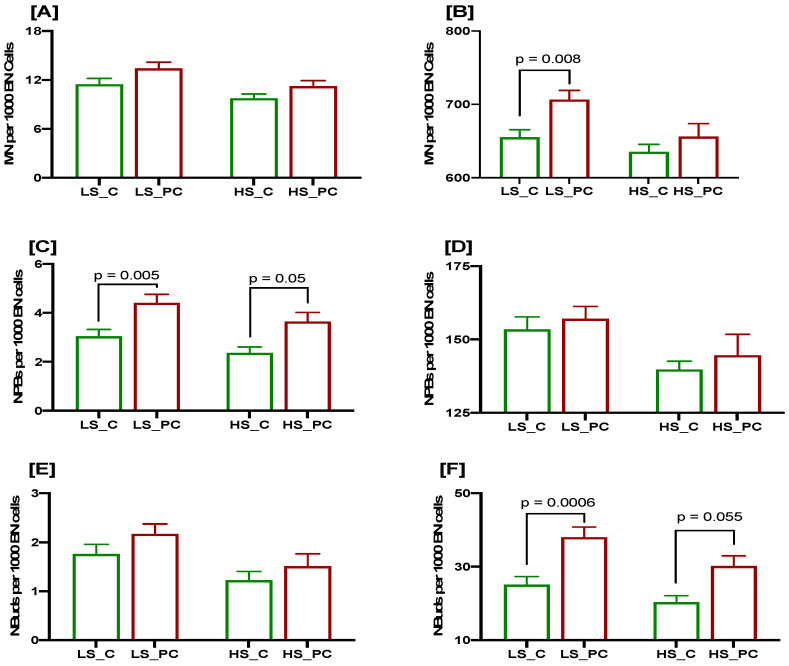
Figure 2.
CBMN Cytome assay biomarkers in PC patients (red bars) and age-matched healthy controls (green bars) stratified as per selenium concentration (LS: low selenium; HS: High selenium); MN frequency at baseline (A) and after 3 Gy irradiation (B); NPBs at base line (C) and after 3 Gy irradiation (D); NBuds at baseline (E) and after 3 Gy irradiation (F). N = 63, 69, 69 and 34, respectively, from left to right for each bar. p values are only indicated for those comparisons that are significant.

