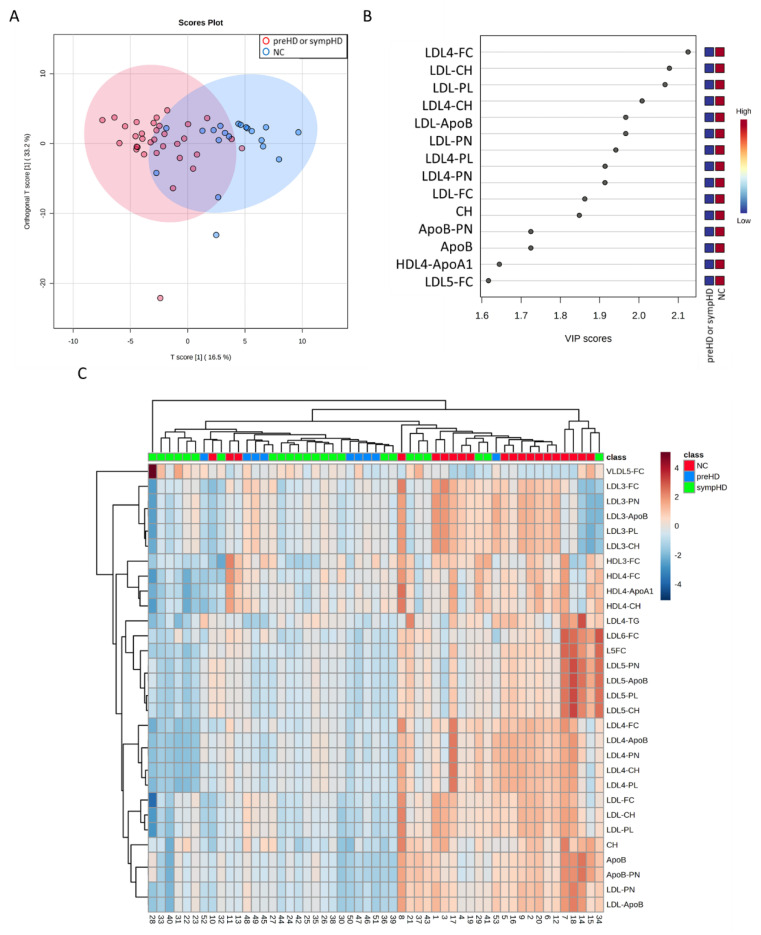
Figure 1.
Orthogonal partial least squares-discriminant analysis (OPLS-DA) of normal controls (NC, n = 20) and patients with symptomatic Huntington’s disease (sympHD) (n = 24) or pre-symptomatic HD (preHD, n = 9). (A) OPLS-DA of metabolites shows a separation between the two groups (R2Y = 0.44, Q2 = 0.30). R2Y, cumulative variation in the Y matrix; Q2, predictive performance of the model. (B) Lipoprotein components with a variable importance in projection (VIP) score greater than 1.6, indicating their contribution to the OPLS-DA model. (C) Heatmap of the hierarchical clustering. The dendrogram at the top shows the clustering of patients, and the dendrogram on the side shows the clustering of metabolites. The colors at the top of the heatmap represent NC, HD or preHD. The colors in the heatmap represent normalized intensities, scaled to a mean of zero and unit variance for each metabolites. ApoA1, apolipoprotein A1; ApoB, apolipoprotein B; CH, cholesterol; FC, free cholesterol; HDL, high-density lipoprotein; LDL, low-density lipoprotein; PL, phospholipid; PN, particle number; VLDL, very low-density lipoprotein.

