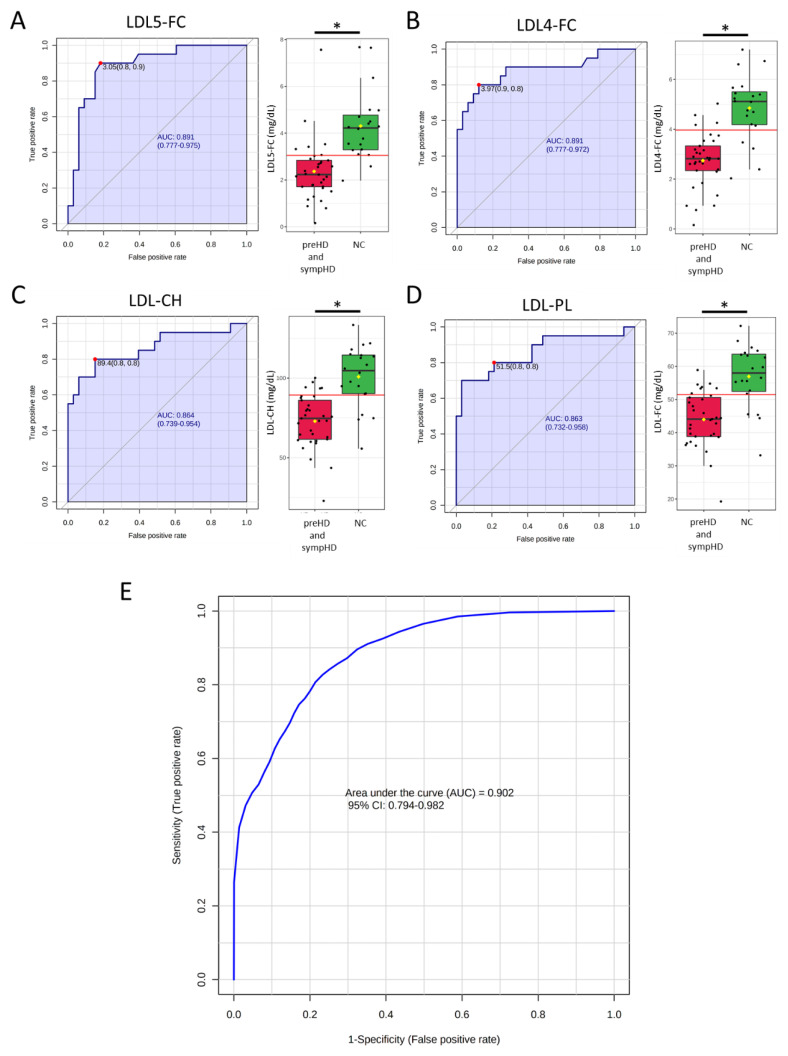
Figure 3.
The receiver operating characteristic (ROC) curve and the box plot for plasma levels of (A) LDL5-FC, (B) LDL4-FC, (C) LDL-CH and (D) LDL-PL. Area under the ROC curve (AUC) was shaded. The black center line in the box plot indicated the median, while the red or green boxes represented the 25th to 75th percentiles. The black whiskers marked the 5th and 95th percentiles, and mean values were represented by yellow diamonds. The red dots and lines denoted the optimal cut-off. *: Statistically significant between two groups, p < 0.05, Mann–Whitney U test. (E) ROC analysis of the above four lipoprotein components using support vector machine. CH, total cholesterol; FC, free cholesterol; LDL, low-density lipoprotein.

