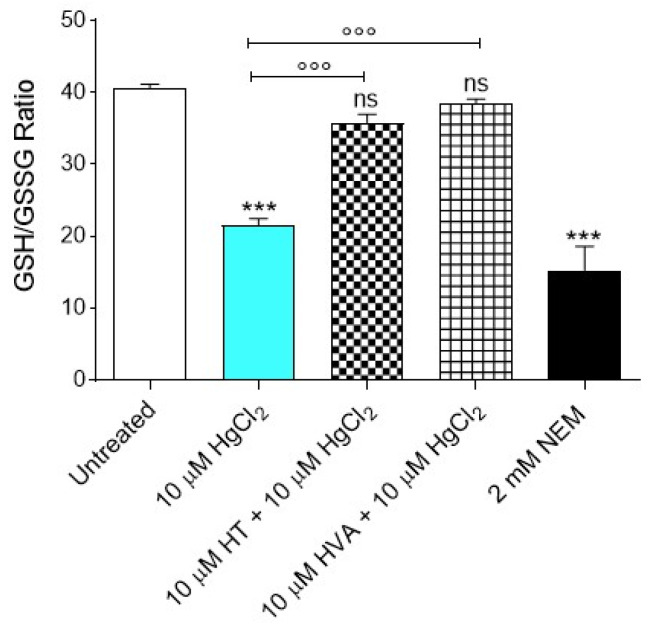
Figure 7.
Estimation of the GSH/GSSG ratio measured in RBCs incubated for 4 h at 37 °C with 10 µM HgCl2 with or without pre-treatment with 10 µM HT and/or HVA (15 min at 25 °C). GSH, reduced glutathione; GSSG, oxidized glutathione. *** p < 0.001 versus left untreated (control) RBCs, °°° p < 0.001 versus 10 µM HgCl2, one-way ANOVA followed by Bonferroni’s multiple comparison post-hoc test (n = 8).

