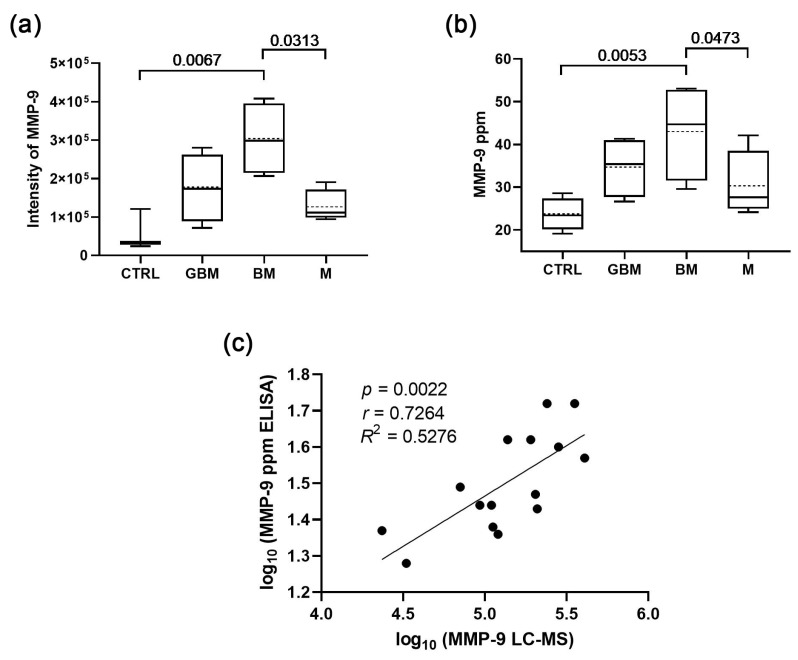
Figure 1.
Comparison of the sEV MMP-9 content measured by ELISA with the LC-MS results. (a) MMP-9 levels of serum-derived sEVs based on LC-MS data (boxplot shows median with interquartile range, mean with dotted line, error bars range from the 5th–95th percentiles (nCTRL = 3, nGBM = 4, nBM = 4, nM = 4). (b) MMP-9 levels of serum-derived sEVs based on ELISA data (nCTRL = 4, nGBM = 4, nBM = 4, nM = 4). Dotted lines indicate mean values. (c) Correlation between the MMP-9 levels measured by LC-MS and ELISA.

