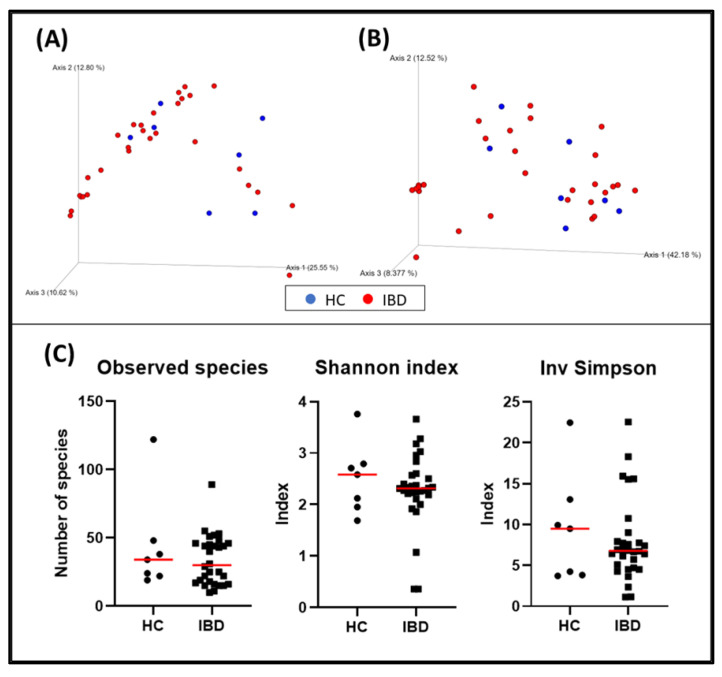
Figure 1.
Bacterial diversity measures of duodenal samples: The dimensional representation of principal coordinate analysis (PCoA) plots of (A) unweighted and (B) weighted UniFrac distances of 16S rRNA genes. Duodenal biopsy specimens from dogs with IBD were not separated from those obtained from healthy dogs (PERMANOVA, p = 0.358; pseudo–F: 1.07). (C) Comparisons of α–diversity: observed species (p = 0.600), Shannon index (p = 0.684), and inverse Simpson index (p = 0.742). Red lines represent the median for each measure. HC, healthy control dogs; IBD, inflammatory bowel disease dogs.

