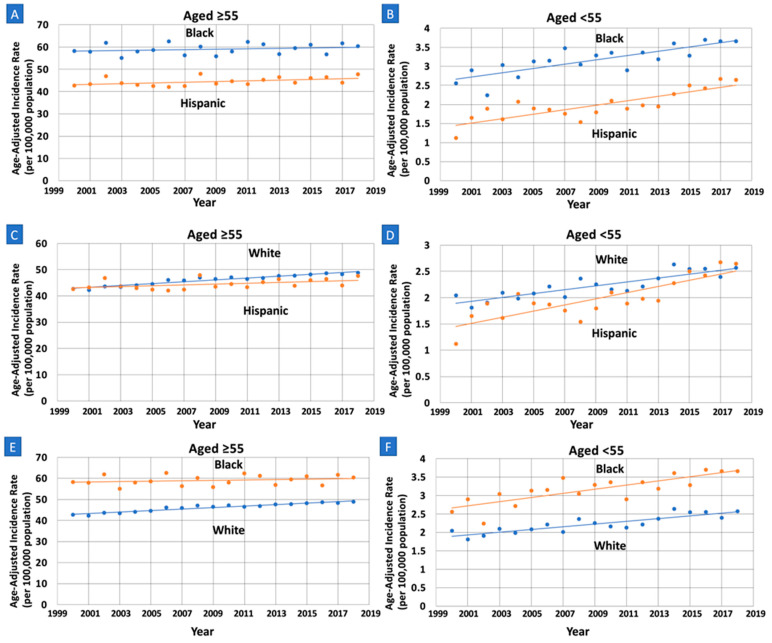
Figure 2.
Race and ethnicity specific trends and age-adjusted pancreatic cancer incidence rates per 100,000 people among older (Age ≥ 55) and younger women (Age < 55). APC: annual percent change. (A): APC increasing in Hispanics and unchanged in Black older women; there is no significant difference (0.38 vs. 0.17, p = 0.34). (B): APC increasing at a greater rate in Hispanic compared to Black younger women (3.03 vs. 1.74, p = 0.028), with trends that are parallel (p = 0.074) and non-identical (p < 0.01). (C): APC increasing at a greater rate in White compared to Hispanic older women (0.80 vs. 0.38, p = 0.021), with trends that are non-parallel (p = 0.016) and non-identical (p < 0.01). (D): APC increasing at a greater rate in Hispanic compared to White younger women (3.03 vs. 1.68, p < 0.001), with trends that are parallel (p = 0.070) and non-identical (p < 0.01). (E): APC increasing at a greater rate in White compared to Black older women (0.80 vs. 0.17, p = 0.001), with trends that are non-parallel (p < 0.01) and non-identical (p < 0.01). (F): APC increasing in Black and White younger women, with no significant difference (1.74 vs. 1.68, p = 0.87).

