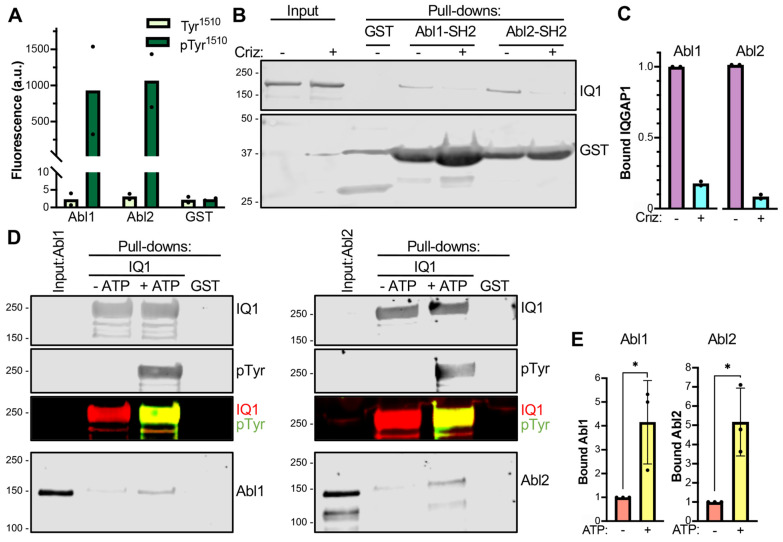
Figure 4.
The SH2 domains of Abl1 and Abl2 bind directly to tyrosine-phosphorylated IQGAP1. (A). Quantification of the fluorescence intensity of the IQGAP1 peptides with unphosphorylated (Tyr1510, pale green bars) or phosphorylated (pTyr1510, dark green bars) Tyr1510 bound to the SH2 domains of Abl1 or Abl2 on the SH2 array. Binding to GST is the control. Data represent the mean fluorescence from two duplicates. a.u., arbitrary units. (B). H1993 cells were incubated with 100 nM crizotinib (criz, +) or vehicle DMSO (−). After 24 h, cells were lysed and equal amounts of protein lysate were incubated with the purified GST-SH2 domains of Abl1 or Abl2 bound to glutathione-Sepharose. Control pull-downs were carried out with GST-glutathione-Sepharose. After washing, proteins attached to the beads were eluted in Laemmli sample buffer and analyzed by Western blotting. The membrane was probed with anti-IQGAP1 (IQ1) and anti-GST antibodies. Input designates unfractionated cell lysates. Both panels are from the same membrane. Blots are representative of two independent experiments. The full blots of the two replicates are shown in Figure S6. (C). The IQGAP1 bands observed after pull-down were quantified using Image Studio 2.0 (LI-COR Biosciences). The intensity of IQGAP1 in DMSO-treated cells was set as 1. Data are presented as the means of two independent replicates. (D). Purified GST-IQGAP1 (IQ1) on glutathione-Sepharose was incubated with purified active MET in the presence (+ATP) or absence (−ATP) of ATP. After washing, beads were incubated with 2 μg of purified Abl1 (left panel) or Abl2 (right panel). Control pull-downs were carried out with GST-Sepharose. After washing, proteins attached to the beads were eluted in Laemmli sample buffer and analyzed by SDS-PAGE and Western blotting. The membrane was probed with anti-IQGAP1 (IQ1), anti-phosphotyrosine (pTyr), and anti-Abl1 or anti-Abl2 antibodies. The overlap between IQGAP1 (red) and pTyr (green) signals is visible in the merged image (yellow). Input designates pure Abl1 or Abl2 not subjected to pull-down. The blots are representative of three independent experiments. The full blots of the three replicates are shown in Figure S7. (E). The Abl1 and Abl2 bands observed after pull-down by GST-IQGAP1 were quantified using Image Studio 2.0 (LI-COR Biosciences). The intensity of Abl1 and Abl2 signals observed with non-phosphorylated IQGAP1 (−ATP) was set as 1. Data are the means ± SD of three independent experiments. Statistical analyses were performed with unpaired t-tests (*, p ≤ 0.05).

