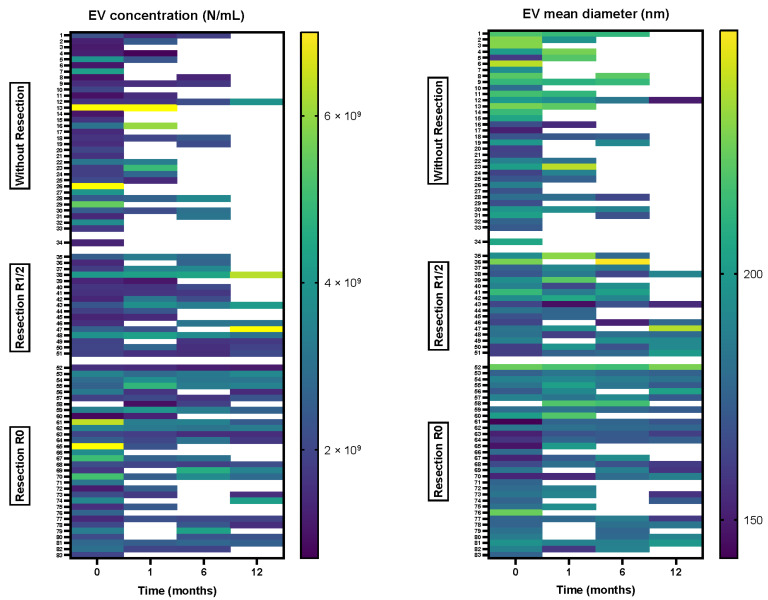
Figure 1.
Heatmaps comparing sEV concentration (left) and mean size (right) for PDAC patients at different time points during follow-up. Patients were grouped according to type and radicality of surgery. Values outside the defined range are presented in yellow. Samples unavailable due to losing patients during follow-up are indicated in white.

