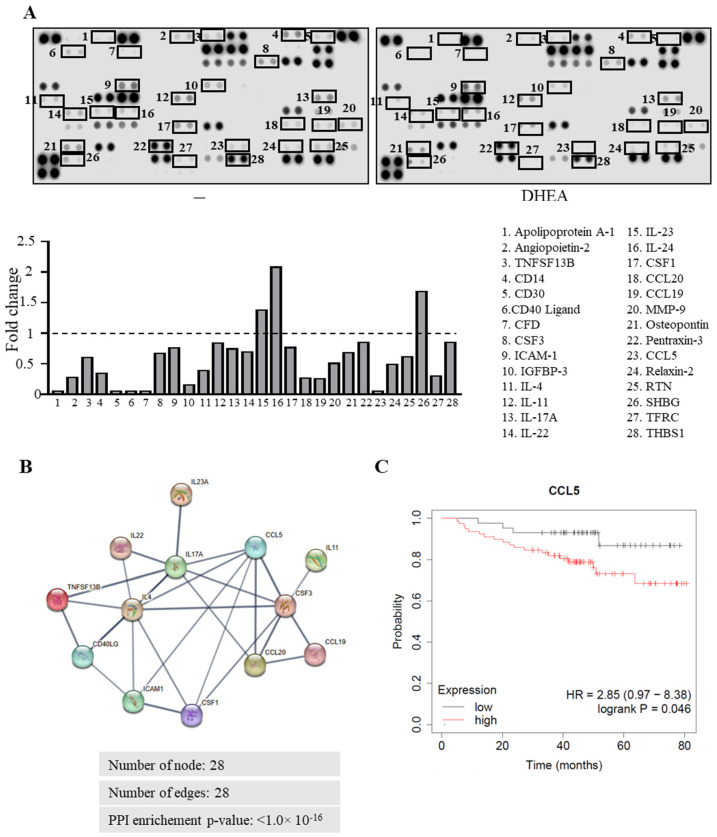
Figure 4.
Effects of DHEA on cytokine secretion profile of TNBC cells. (A) Human cytokine array of the secreted proteins by MDA-MB-231 breast cancer cells treated with vehicle (−) or DHEA 10 μM. Results are presented as fold-over to vehicle-treated cells. (B) Protein–protein interaction (PPI) network visualized by STRING 11.5 online tool (https://string-db.org/, accessed on 28 July 2022). The nodes indicate proteins, and the edges indicate the number of interactions. Disconnected nodes are hidden, and only interactions with a high confidence score of >0.7 are shown. (C) Kaplan-Meier survival analysis relating CCL5 levels (using the median of expression as cutoff) and overall survival in TNBC patients. Hazard ratio (HR) and p-value are shown.

