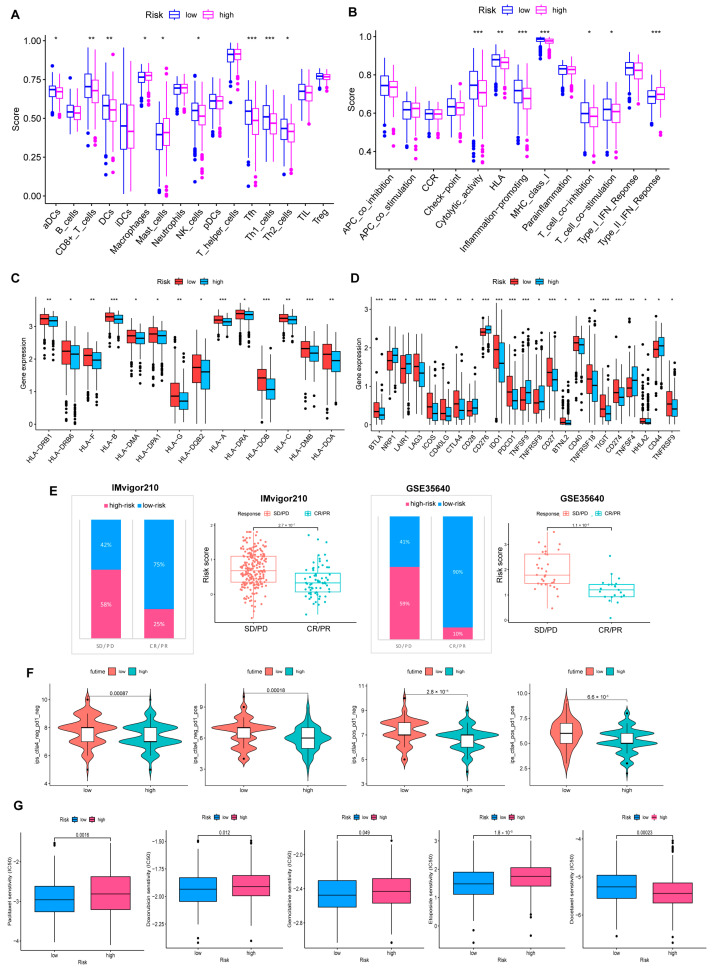
Figure 7.
Comprehensive analysis of the TME of risk cohorts. (A,B) Differences in immune cell infiltration and immune function between two risk groups. (C) The two groups have differences in immune HLA gene expression and (D) ICP gene expression. (* p < 0.05; ** p < 0.01; *** p < 0.001). (E) Validate the predictive value of the model in the immunotherapy group. (F) Immunotherapy responsiveness of the two groups. (G) Association between risk score and susceptibility to chemotherapy.

