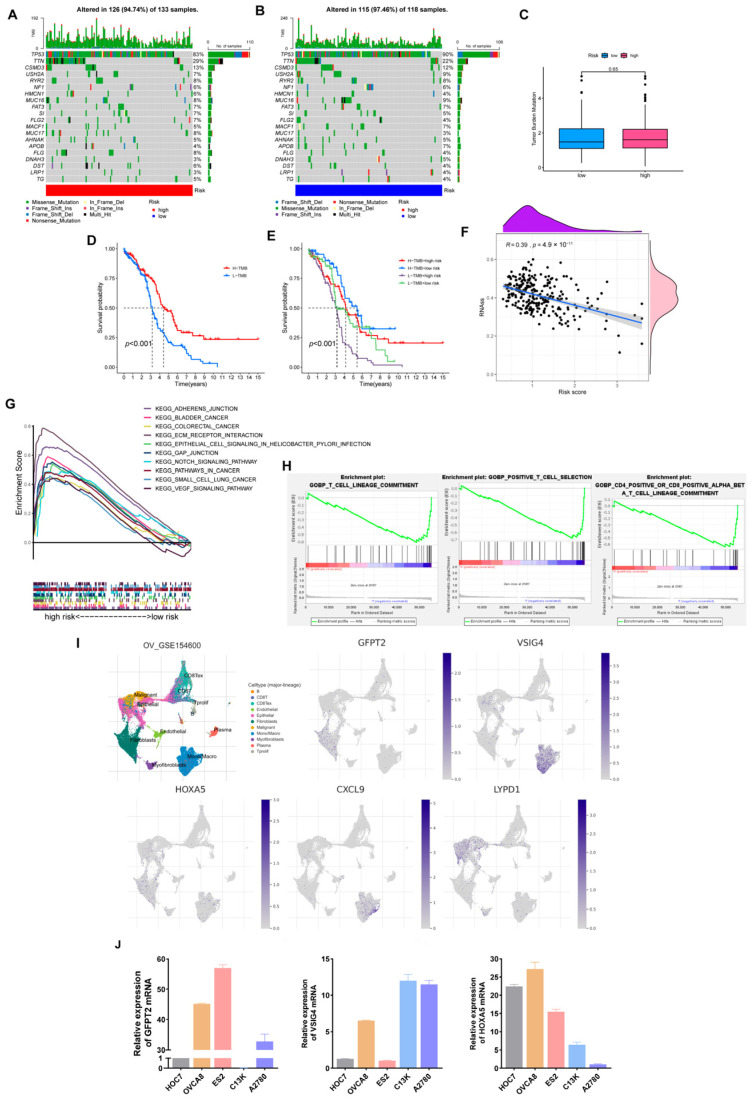
Figure 8.
Comprehensive analysis of the risk model in OV. (A,B) Somatic mutation landscape in different risk sets. (C) TMB comparison of two groups. (D,E) Relevance of TMB and risk scores to prognosis. (F) Correlation of risk scores and Stemness Scores. (G) KEGG pathways enriched in the high-risk set. (H) GO-BP enrichment results in the low-risk cohort. (I) The expression of five hub genes is based on GSE154600. (J) Verification of three hub genes’ expression in ovarian cancer cell lines.

