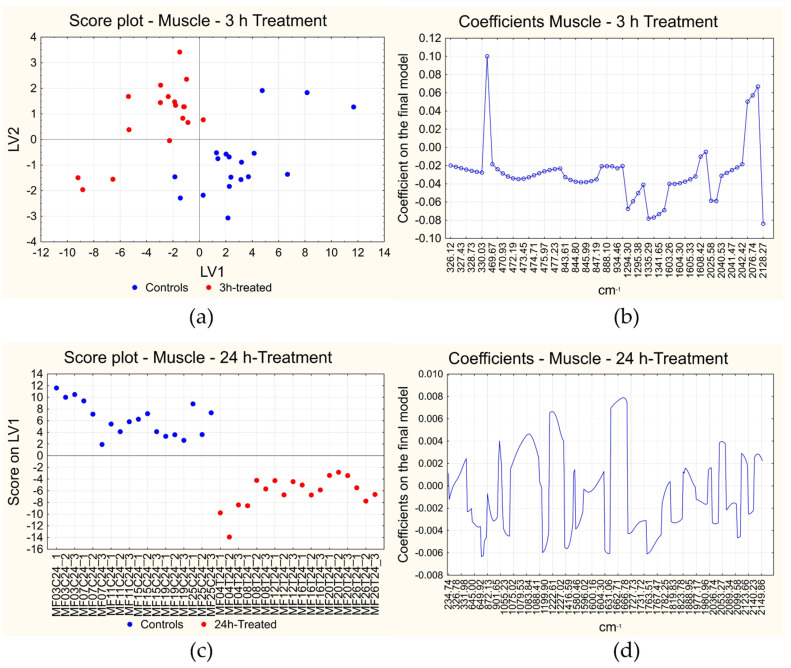
Figure 5.
Results of PLS-DA on muscle. Score plot (a) and plot of the coefficients (b) of short-term treatment and long-term treatment (c,d). The short-term score plot reports the scores of each measurement in the space given by the first two latent variables (LVs) calculated; the long-term score plot reports the score of each measurement on the first LV (LV1) on the y-axis and the measurements on the x-axis. In the score plots the samples are indicated in blue if they are controls and in red if they are treated samples. The plots of the coefficients report the variables included in the final models on the x-axis and the coefficients on the final model on the y-axis. Positive coefficients correspond to variables with a higher signal in the first derivative of treated samples, while negative coefficients correspond to variables with a lower signal in the same situation.

