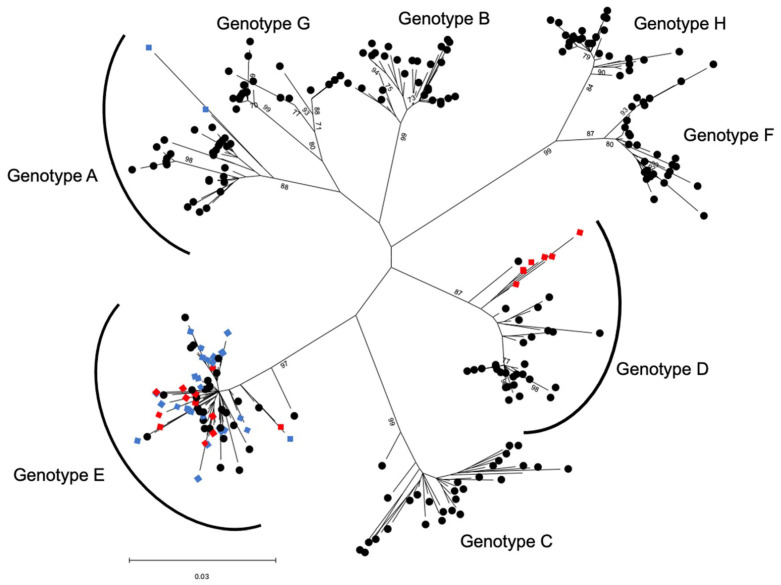
Figure 1.
Phylogenetic analysis of HBV sequences based on 969 nt of the viral HBS gene compared to reference sequences for each viral genotype A–H. The phylogenetic tree was constructed using the maximum likelihood method and the Tamura–Nei model [37]. The tree with the highest log likelihood (−8124.86) is shown. This analysis involved 284 nucleotide sequences with a total of 969 positions in the final dataset. The points shown with blue diamonds represent samples collected in Bamako (Mali) and the points shown with red diamonds represent samples from Timbuktu (Mali). The black circles represent reference sequences.

