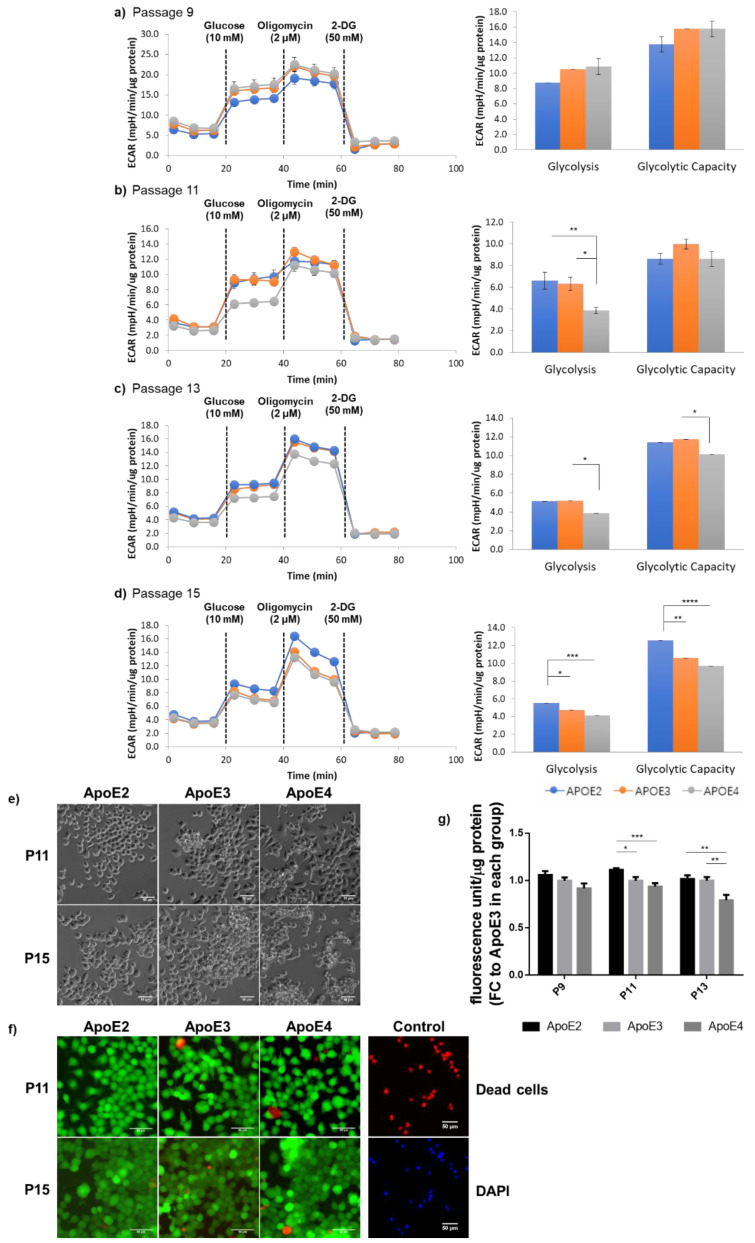
Figure 3.
ApoE2- and ApoE4-expressing cells exhibited age-dependent divergent glycolytic profiles, which paralleled with changes in the general state of cellular health. (a–d) Glycolytic activity of ApoE-expressing cells at P9, P11, P13, and P15 was analyzed using a Seahorse XF96 extracellular flux analyzer. The ECAR readout was normalized by the total protein content in the sample in each well. n = 10–16/group. (e) Representative phase contrast images were obtained on the fourth day after cell seeding at indicated passages. (f) The LIVE/DEAD (green/red) cell staining was conducted and showed no significant cell death in any of the cell lines at up to P15. Image regions displayed had similar cell densities at about 80% confluency. Scale bars, 50 μm. (g) Metabolic activity of ApoE-expressing cells was analyzed using a Resazurin-based PrestoBlue assay in cells seeded on 96-well plates for 4 days and normalized by the total protein content in the sample in each well. n = 12–18/group. Results were normalized to the ApoE3 group in each passage. * p < 0.05, ** p < 0.01, *** p < 0.001, **** p < 0.0001.

