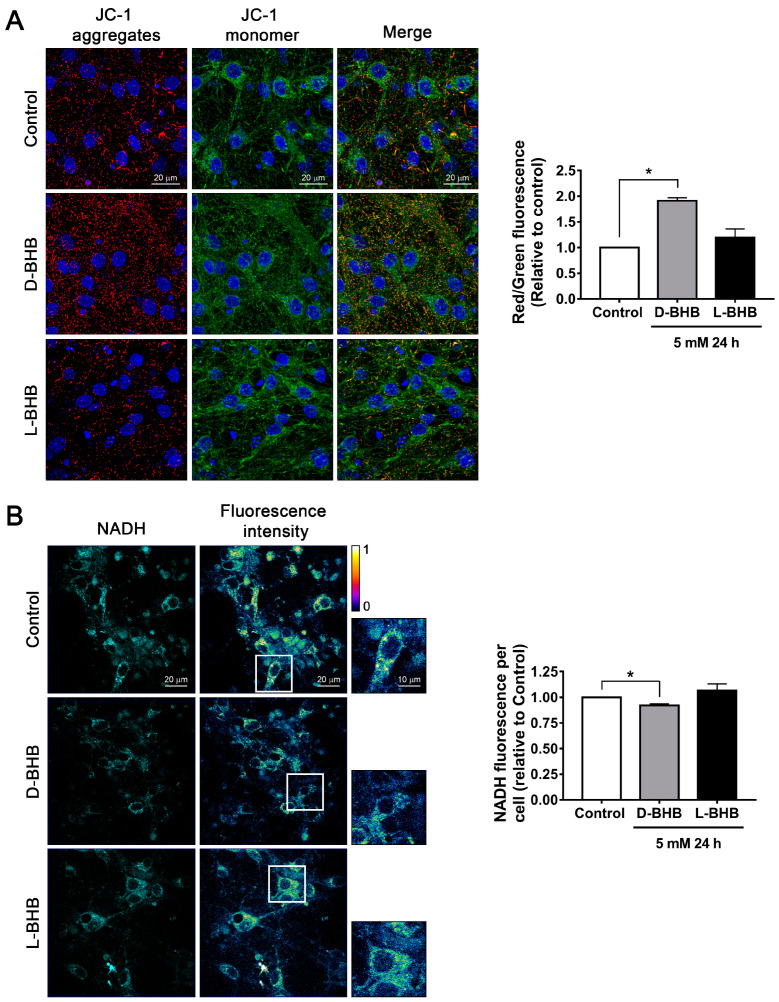
Figure 1.
D-BHB treatment promotes mitochondrial function in cultured cortical neurons. (A) Left: representative images of mitochondrial membrane potential assay using JC-1 in neurons treated and non-treated with 5 mM of D-BHB or L-BHB for 24 h. Right: graph showing the red/green fluorescence ratio per condition shown as a fold change relative to control. (B) Left: representative images of NADH auto-fluorescence (cyan) and intensity spectrum (blue—lower intensity and yellow—higher intensity). Right: graph showing mean NADH intensity per cell of cortical neurons treated and non-treated with 5 mM of D-BHB or L-BHB for 24 h. Data are expressed as Mean ± SEM from 3 (A) or 5 (B) independent experiments. Data were analyzed by one-way ANOVA followed by Fisher’s post-hoc test. * p < 0.05 vs. control.

