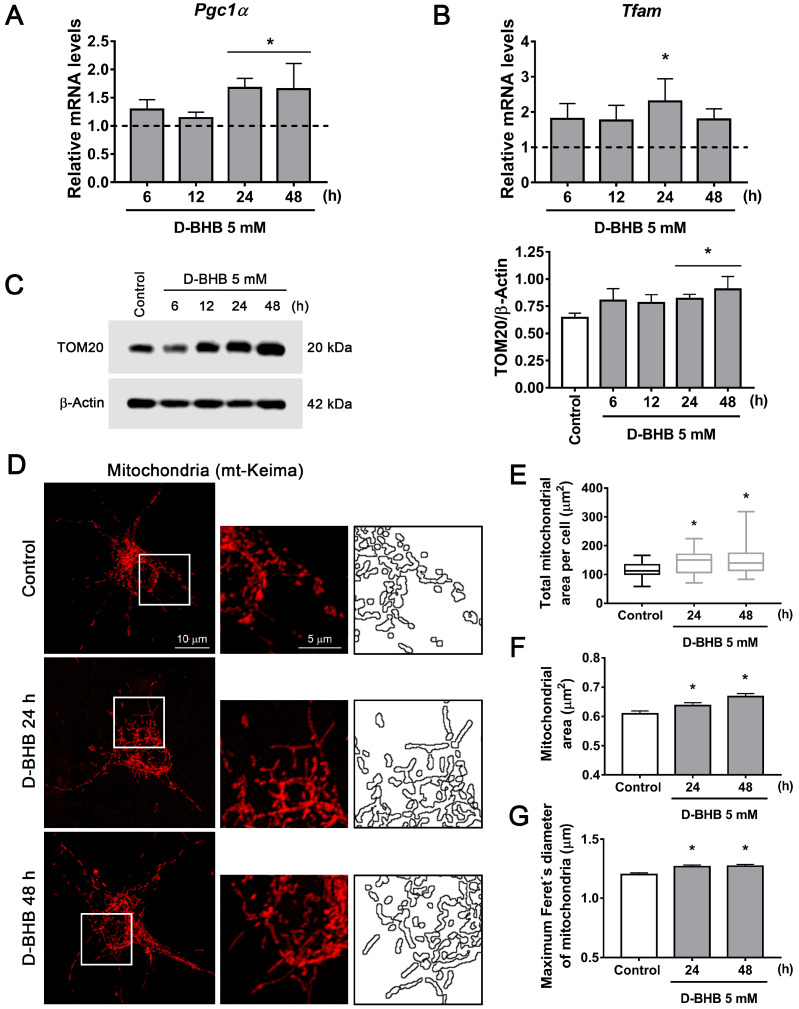
Figure 2.
Effect of D-BHB on mitochondrial biogenesis in cortical neurons. Expression of (A) Pgc1α and (B) Tfam detected by qRT-PCR in control cultures and cultures exposed to 5 mM D-BHB for different times. (C) Representative Western blot and quantification of TOM20/β-actin. (D) Representative micrographs of neurons transfected with mKeima-red-mito (mt-Keima) and treated and non-treated with 5 mM B-BHB for 24 or 48 h. (E) Quantification of total mitochondrial area per cell, (F) individual mitochondrial area and (G) maximum Feret’s diameter of mitochondria treated and non-treated with 5 mM of D-BHB for 24 or 48 h. Data are expressed as Mean ± SEM from 4 (A,B), 6 (C) or 3 (F,G) independent experiments. Box-plot data (E) are expressed as median (line), 25th and 75th percentiles (bound of box) and minimum and maximum values (whiskers) from 23 cells of 4 independent experiments. Data from A, B and C were analyzed by one-way ANOVA followed by Fisher’s post-hoc test. Data from E, F and G were analyzed by Kruskal–Wallis test followed by Dunn´s post hoc test. * p < 0.05 vs. control.

