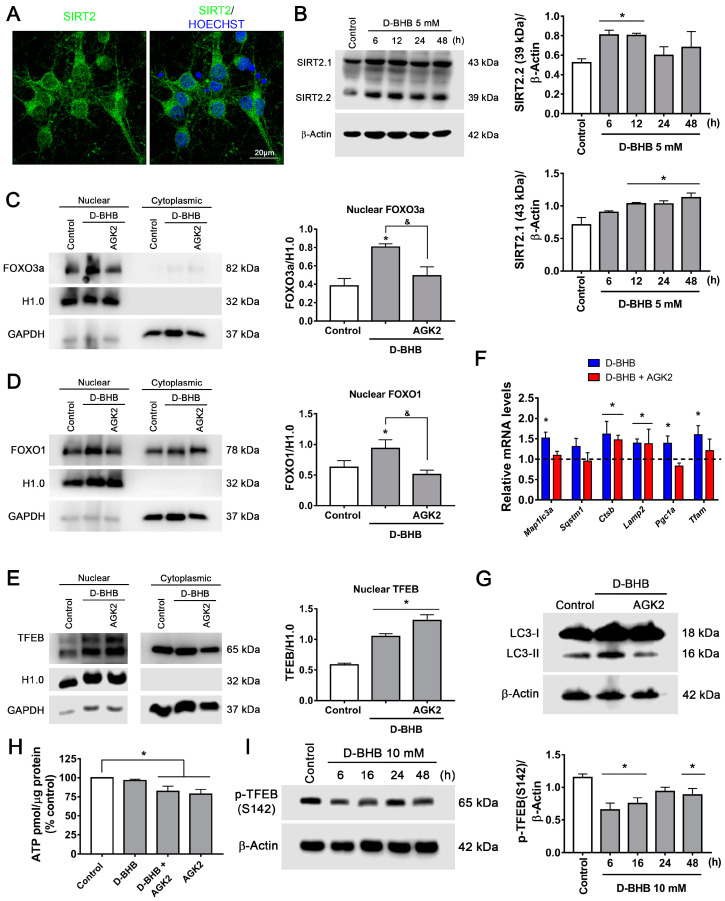
Figure 8.
Effect of SIRT2 inhibition on FOXO3a, FOXO1 and TFEB nuclear localization in neurons treated with D-BHB. (A) Representative images of SIRT2 immunofluorescence in cortical neurons. (B) Representative western blot and quantification of SIRT2.1/β-actin and SIRT2.2/β-actin. Analysis of SIRT2 inhibition by AGK2 on nuclear or cytoplasmic localization of FOXO3a (C), FOXO1 (D) and TFEB (E). Representative immunoblot (left) and quantification (right). Histone H1.0 was used as a nuclear loading control, and GAPDH was used as a cytoplasmic loading control. (F) Expression of autophagy, lysosomal and mitochondrial biogenesis genes detected by qRT-PCR in cortical neurons exposed to 5 mM of D-BHB for 24 h with or without AGK2 (5 μM). (G) Transformation of LC3-I to LC3-II in cells treated with D-BHB with or without AGK2. (H) ATP levels in control cells and cells treated with D-BHB, AGK2 or AGK2+D-BHB. (I) p-TFEB (S142) levels in cells treated with D-BHB at different times. Representative immunoblot (left) and quantitative data (right). Data are expressed as Mean ± SEM from 3 (B), 6 (C,E) or 4 (D,F,H,I) independent experiments. Data were analyzed by one-way ANOVA followed by Fisher’s post-hoc test. * p < 0.05 vs control; & p < 0.05 vs. D-BHB.

