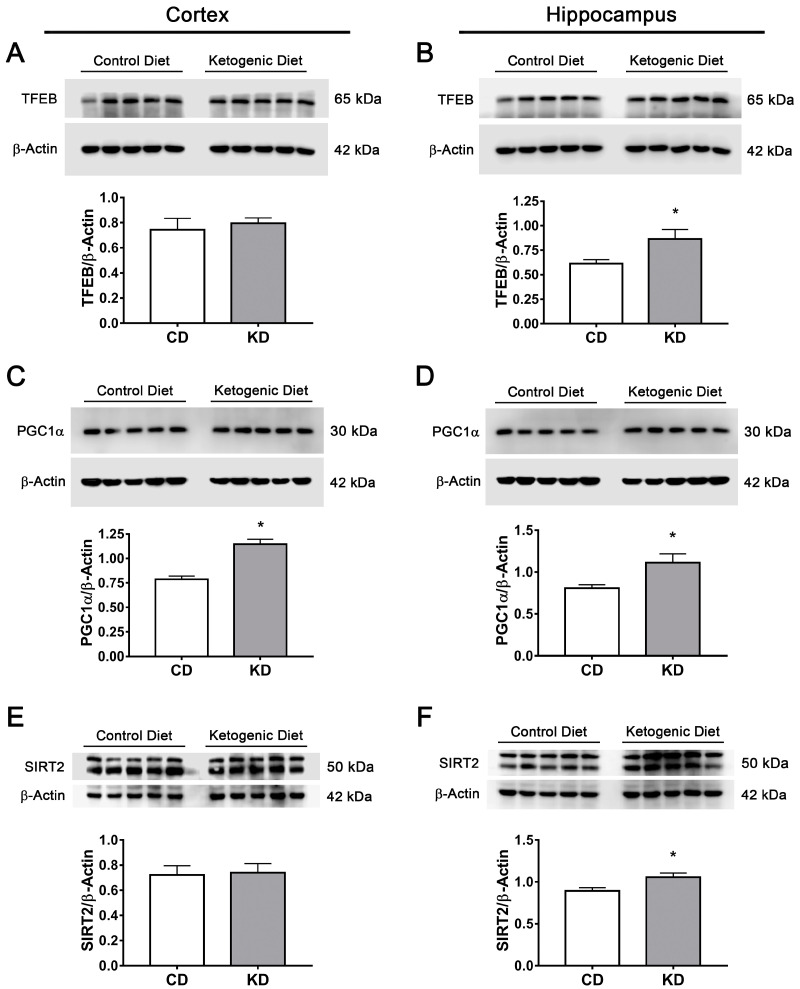
Figure 11.
Changes in TFEB, PGC1a and SIRT2 brain levels of mice treated with control or ketogenic diet. Representative Western blot and quantification of (A,B) TFEB/β-actin, (C,D) PGC1α/β-actin and (E,F) SIRT2/β-actin in the cortex (A,C,E) and the hippocampus (B,D,F) of mice treated for 2 weeks with control diet or KD. Data are expressed as Mean ± SEM from 8 individuals per group. Data were analyzed by Student´s t-test. * p < 0.05 vs. control diet.

