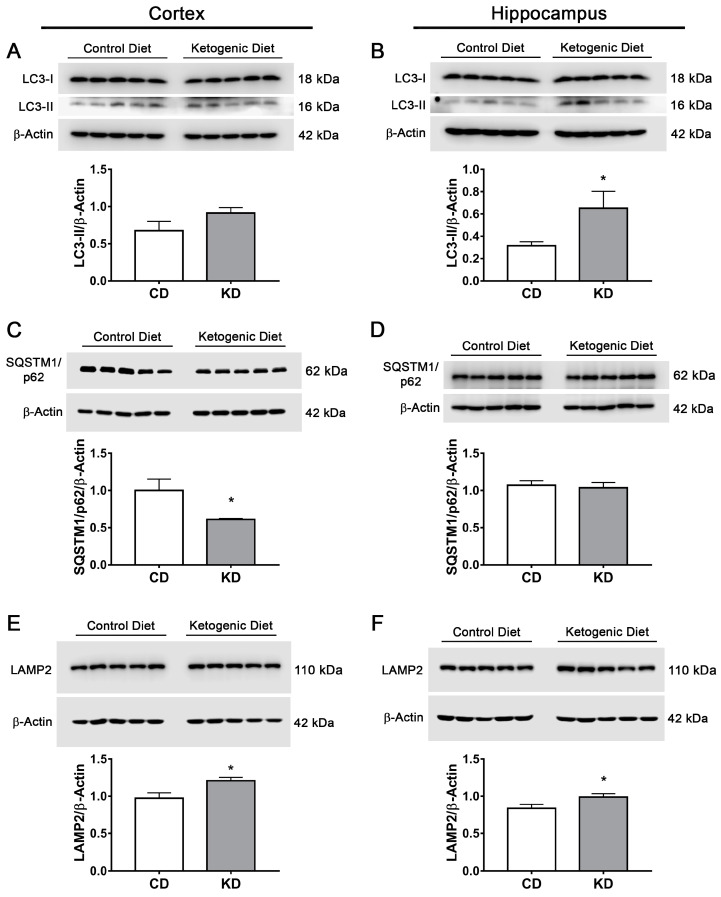
Figure 12.
Changes in autophagy and lysosomal biogenesis markers in the brain of mice treated with control diet or ketogenic diet. Representative Western blot and quantification of (A,B) LC3-II/β-actin, (C,D) SQSTM1/p62/β-actin and (E,F) LAMP2/β-actin in the cortex (A,C,E) and the hippocampus (B,D,F) of mice treated for 2 weeks with control diet (CD) or ketogenic diet (KD). Data are expressed as Mean ± SEM from 8 individuals per group. Data were analyzed by Student’s t-test. * p < 0.05 vs. control diet.

