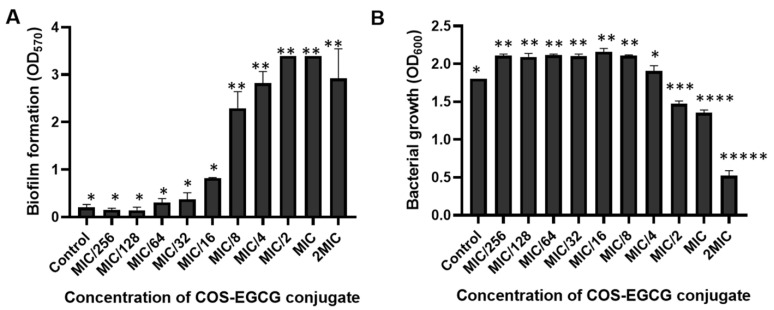
Figure 2.
Biofilm formation (A) and the growth (B) of L. monocytogenes after treatment with COS-EGCG conjugate at different concentrations, as well as the control with 0.01% acetic acid in the TSB medium. The different asterisks on the bars denote significant differences (p < 0.05). The results are presented as means ± SD (n = 3).

