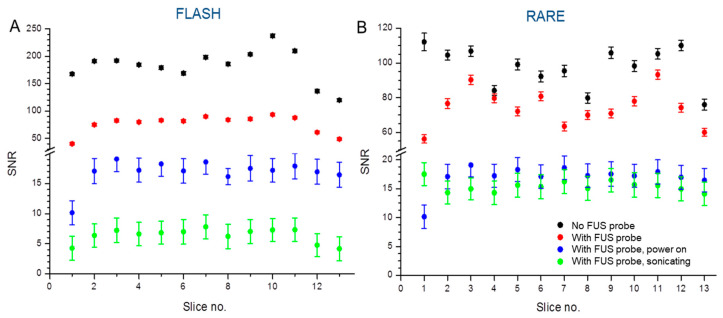
Figure 3.
Measured mean signal-to-noise ratio profiles in 7 T of FLASH and RARE sequences of the phantom. (A) FLASH sequences show consistent values across all 13 slices. (B) RARE sequences show inconsistent image homogeneity for the slices located at the very beginning and very end of the phantom. (The position of the phantom and the transducer are shown in Figure 2.) The data between groups are significantly different p ≤ 0.05.

