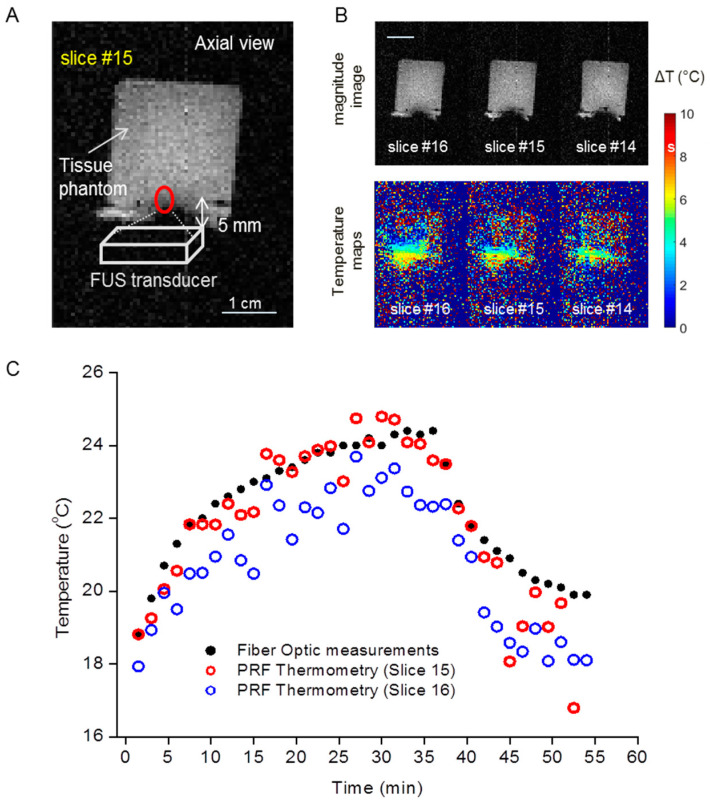
Figure 5.
Temperature measured by fiber optic and PRF thermometry is consistent in the TMP. (A) Positioning of the FUS transducer and magnitude image of TMP. Red circle show the focus point of the transducer. (B) Temperature mapping of different slices after a series of sonications for 30 min. (C) The PRF thermometry measured temperatures are consistent with the temperatures measured by the fiber optic probe.

