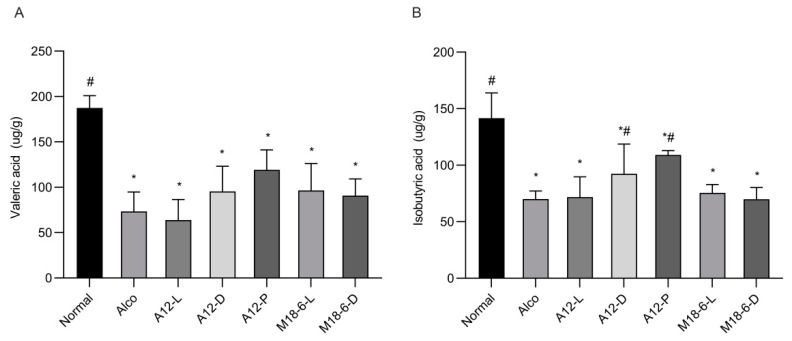
Figure 6.
Short-chain fatty acid level in mice. (A): Valeric acid; (B): Isobutyric acid. Compared with normal group (p < 0.05) *, compared with Alco group (p < 0.05) #. Normal: normal saline-fed; Alco: alcohol-fed group; A12-L: alcohol-fed with live B. animalis A12 cells group, A12-D: alcohol-fed with dead B. animalis A12 cells group, A12-P: alcohol-fed with B. animalis A12 freeze-dried power group, M18-6-L: alcohol-fed with live L. salivarius M18-6 cells group, and M18-6-D: alcohol-fed with dead L. salivarius M18-6 cells group.

