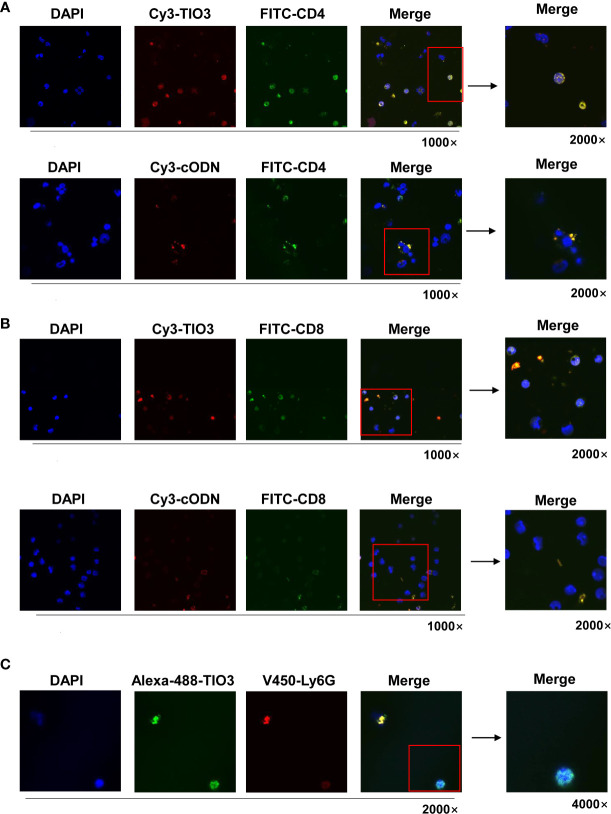
Figure 2.
The TIO3 distribution in CD4+ T and CD8+ T cells. The lymph node (LN) cells from naive mice (n = 4) were incubated with red-fluorescent Cy3-TIO3 or Cy3-cODN or with green-fluorescent Alexa-488-TIO3 for 24 h, then stained with green-fluorescent (FITC-labeled) mAbs against CD4 (A) or CD8 (B) or red-fluorescent (V450-labeled) mAb against ly6G (C), respectively, followed by counterstaining with DAPI, a blue fluorescent DNA dye for staining the nucleus. The resultant cells were observed under the confocal microscope. (Magnification, × 1000, × 2000, × 4000).

