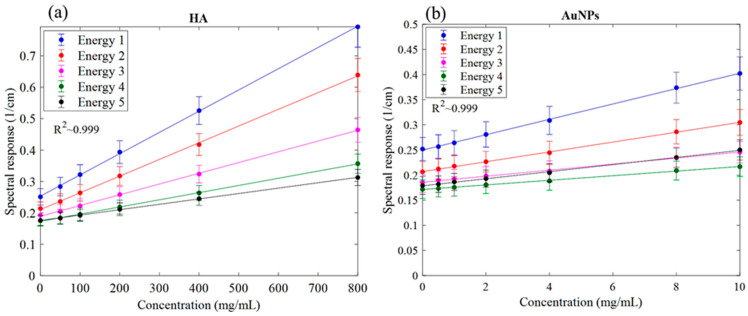
Figure 4.
Linearity of the detector spectral response. (a) Linearity of attenuation of HA (Spectral response). (b) The linearity of attenuation of AuNPs (Spectral response). The result of the linear regression shows that the CT system is linear with R2 values indicated on the graph. Accuracy of material identification and decomposition is based on the linearity established for each energy bin, using the calibration vials.

