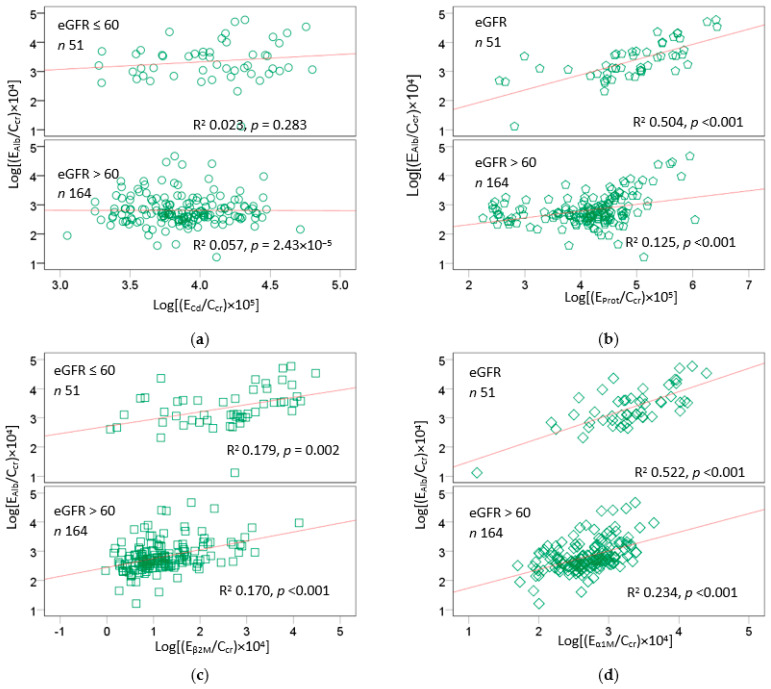
Figure 2.
Effects of cadmium exposure and nephron mass on excretion of albumin. Scatterplot (a) relates log[(EAlb/Ccr) × 104] to log[(ECd/Ccr) × 105]. Scatterplot (b) relates log[(EAlb/Ccr) × 104] to log[(EProt/Ccr) × 105]. Scatterplot (c) relates log[(EAlb/Ccr) × 104] to log[(Eβ2M/Ccr) × 104]. Scatterplot (d) relates log[(EAlb/Ccr) × 104] to log[(Eα1M/Ccr) × 104]. Units of EAlb/Ccr, Eβ2M/Ccr, and Eα1M/Ccr are mg/L of filtrate, and the unit of ECd/Ccr is µg/L of filtrate. Coefficients of determination (R2) and p-values are provided for all scatterplots.

