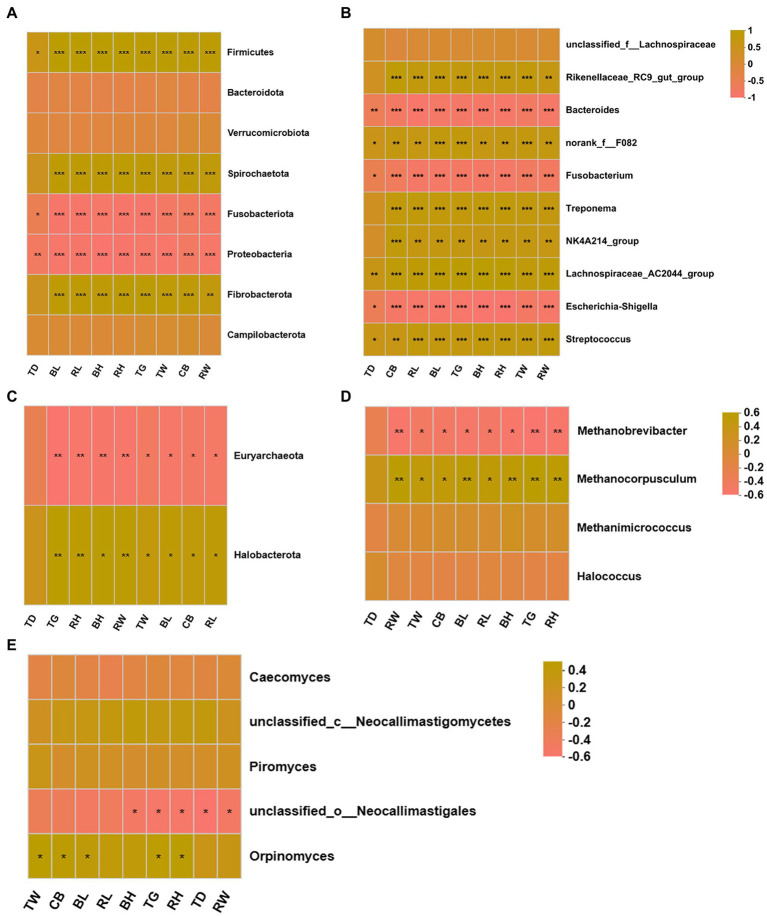
Figure 8.
Correlation heatmap of differentially donkey fecal microbiota and body measurements. Each row in the graph represents a microbiota phylum/genus, each column represents a body measurement, the color in the graph indicates the Pearson coefficient between the microbial phylum/genus and donkey body measurements, and the brick yellow indicates positive correlation. The pale pink is representative negative correlation. The darker color indicate the greater the correlation. (A) Between donkey body measurements and bacteria at phylum level. (B) Between donkey body measurements and bacteria at genus level. (C) Between donkey body measurements and anaerobic fungi at phylum level. (D) Between donkey body measurements and anaerobic fungi at genus level. (E) Between donkey body measurements and archaea at genus level. *p < 0.05; **p<0.01; ***p<0.001. BH, body height; BL, body length; TG, thoracic girth; TD, thoracic depth; TW, thoracic width; RH, rump height; RL, rump length; RW, rump width; CB, circumference of cannon bone.

