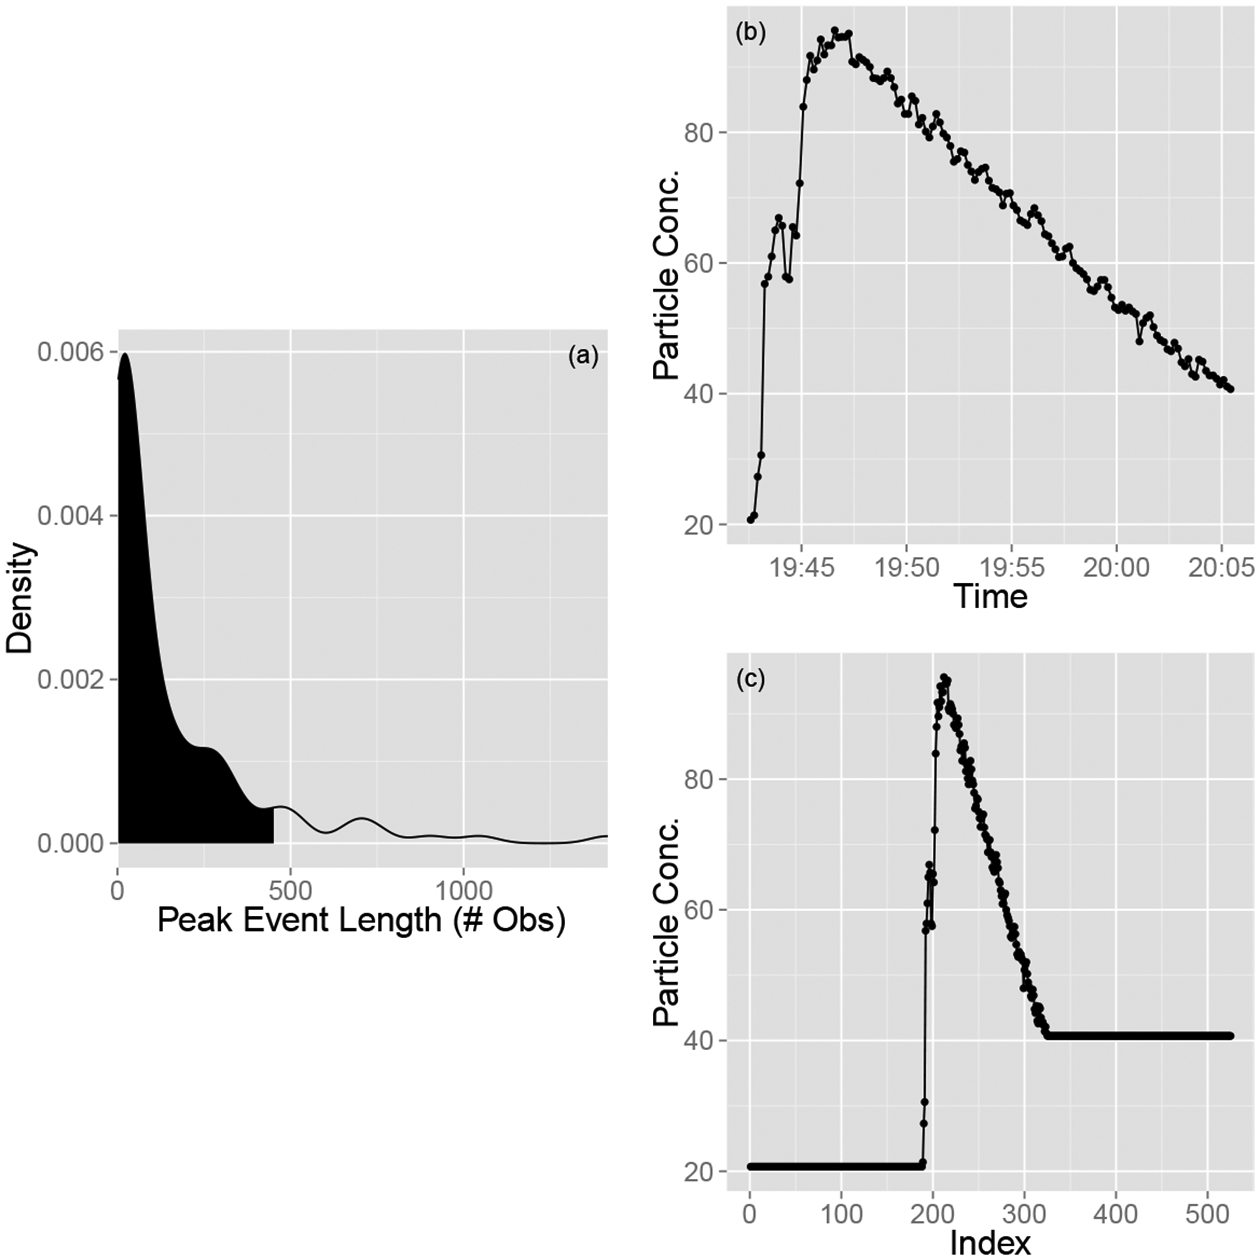
Figure 1:

Panel (a) Distribution of the length of peak events. The shaded region represents the 90th percentile. Panels (b)-(c) The padding procedure for Peak 15 (in temporal order). The peak as it appears in the time-series is shown in Panel (b); Length(l15)=138 and center of mass (ν15) = 63. Panel (c) illustrates the peak after 187 and 200 dummy variables have been added to the beginning and end of the peak, respectively. The event, along with all others, now has observations, enough to account for centering every peak event in the full data series about its center of mass. Note that the average has not been subtracted out.
