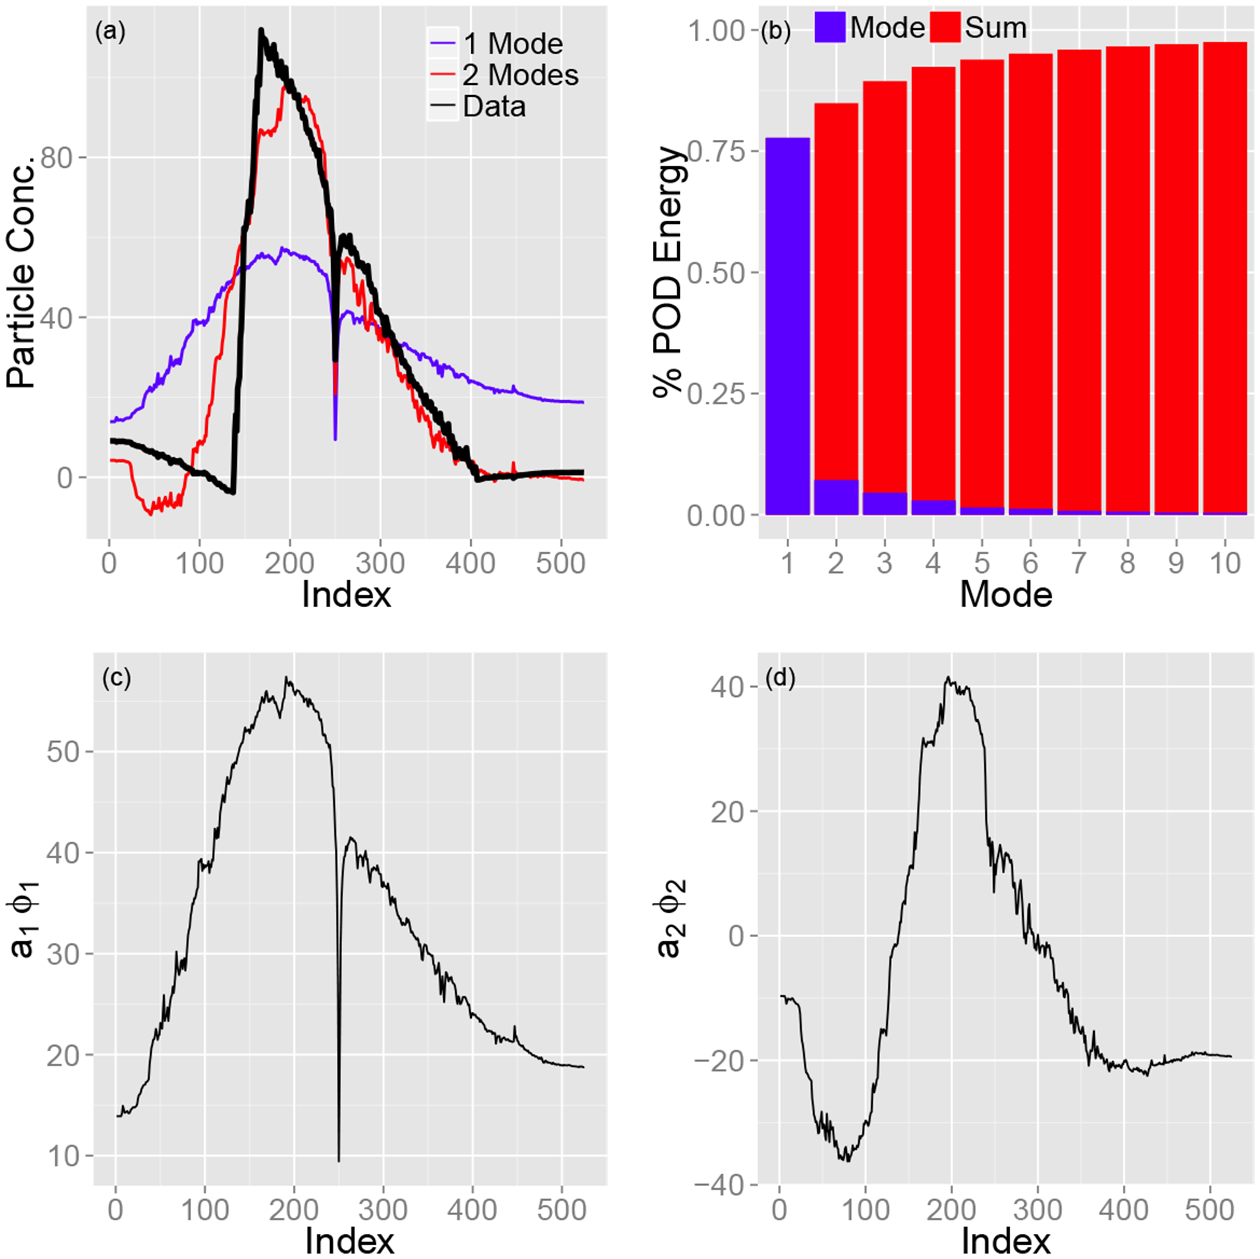
Figure 2:

Proper orthogonal decomposition (POD) results. (a) Reconstruction of the 24th peak (in temporal order). The thick black line corresponds to the original peak while the blue and red lines represent POD reconstructions using, respectively, 1 and 2 POD modes. (b) Individual and cumulative average variance accounted for by the first ten eigenmodes, ϕi. Note ϕ1 ≈ 79% and ϕ1 + ϕ2 ≈ 86% of the total variance. (c)-(d) The first two eigenmodes ϕ1 and ϕ2, respectively.
