
Figure 3:
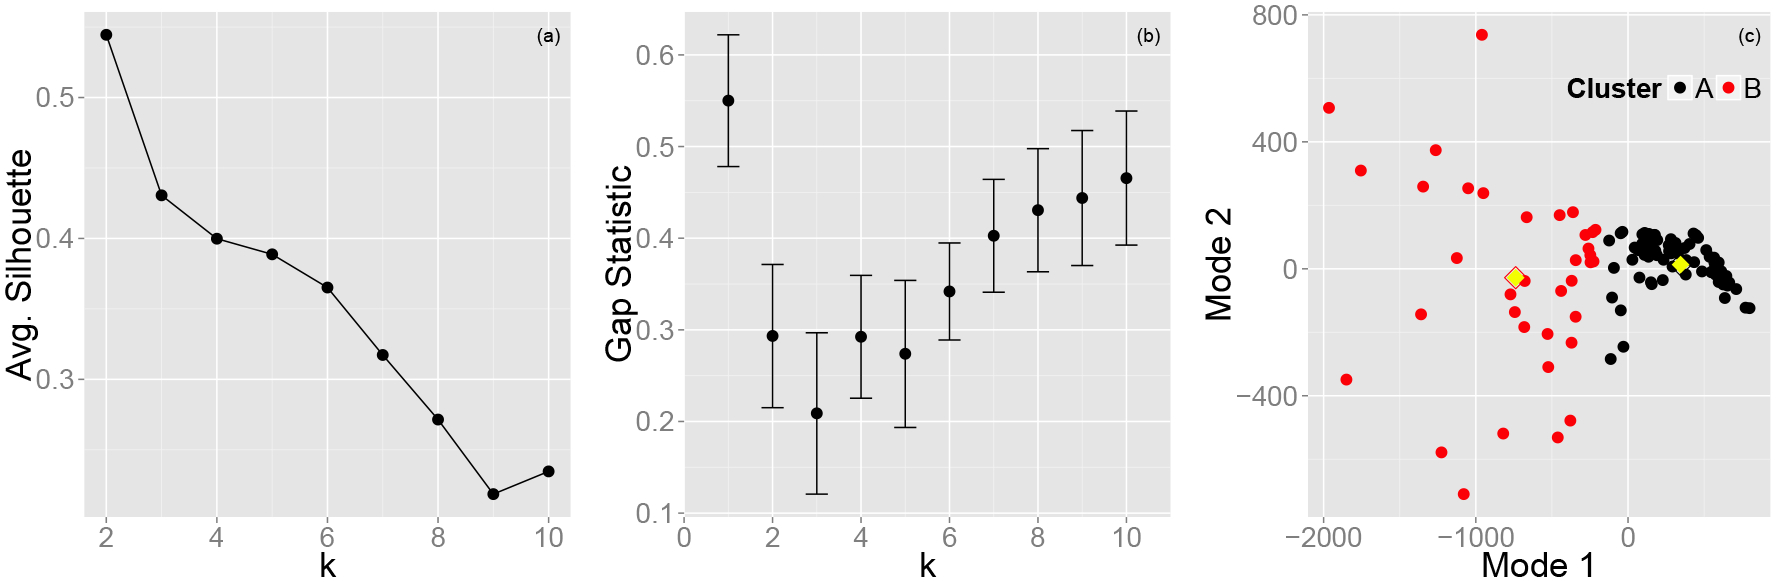
Weighted k-means clustering. (a) Average silhouette. (b) Gap statistic. (c) Each point represents a peak. Its two coordinates are the coefficients corresponding to the first two eigenfunctions ϕ1 and ϕ2. k = 2 was used and each peak is classified as Type A (black) or Type B (red). The filled yellow diamonds represent the centroid of each cluster.