Figure 5:

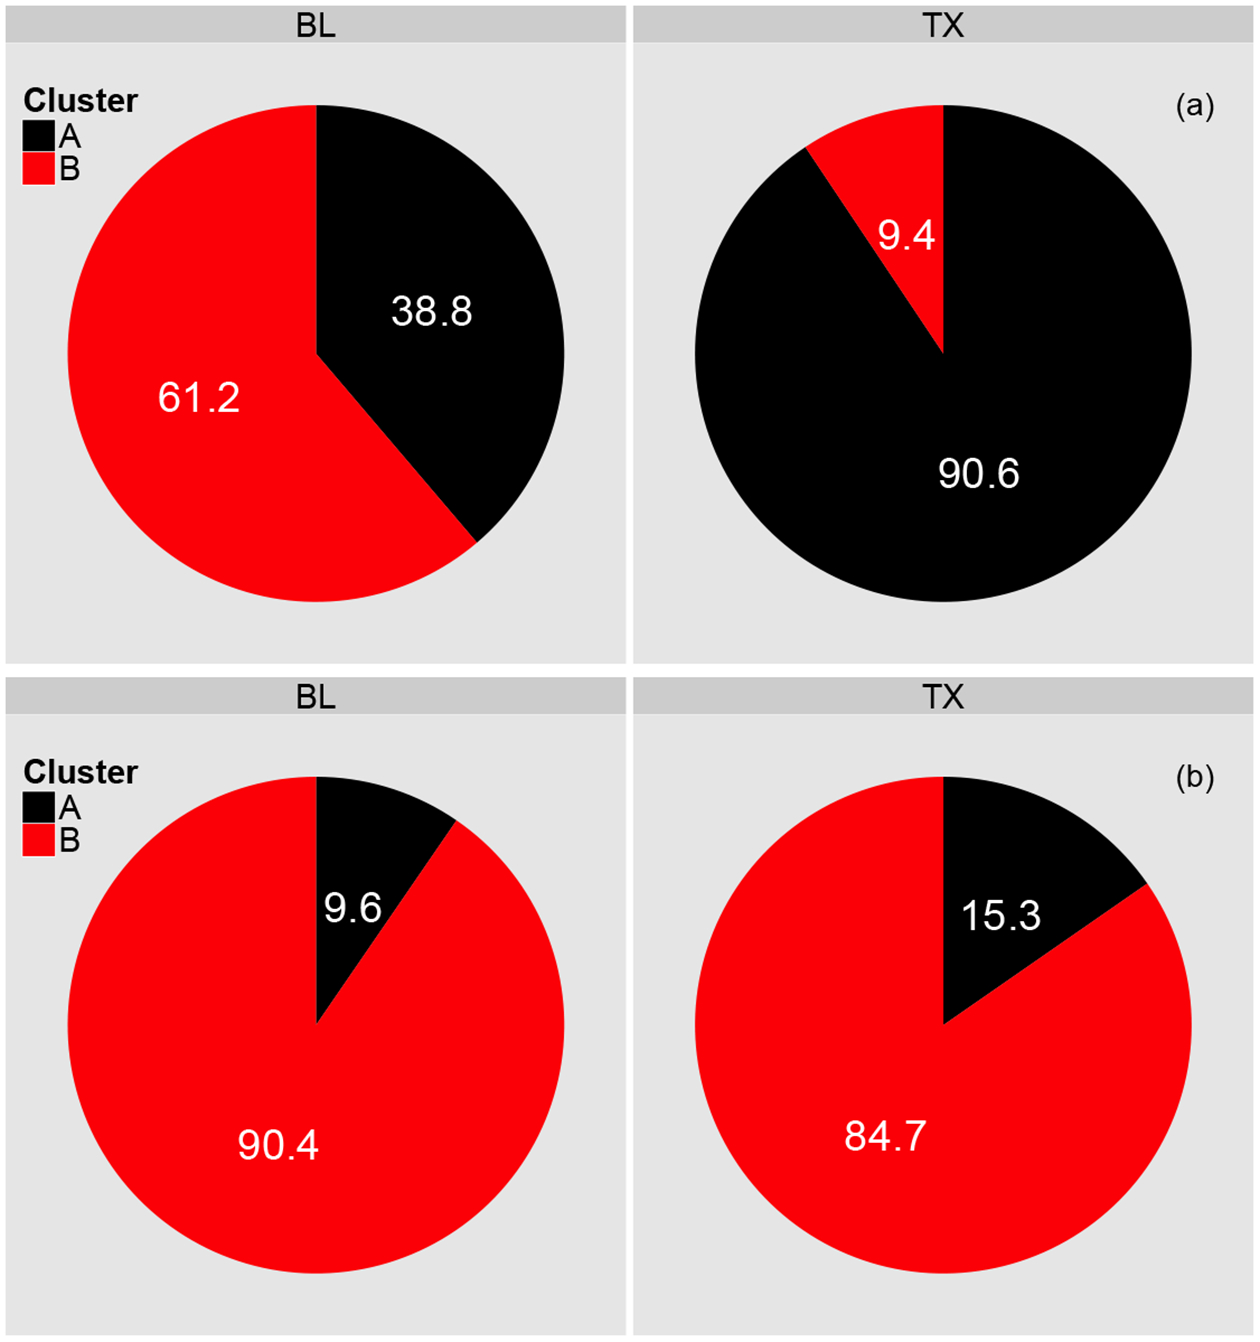
Intervention Effect. (a) Proportion of total number of peaks accounted for by each cluster stratified by intervention phase. (b) The same analysis but for proportion of total area under the curve.

Intervention Effect. (a) Proportion of total number of peaks accounted for by each cluster stratified by intervention phase. (b) The same analysis but for proportion of total area under the curve.