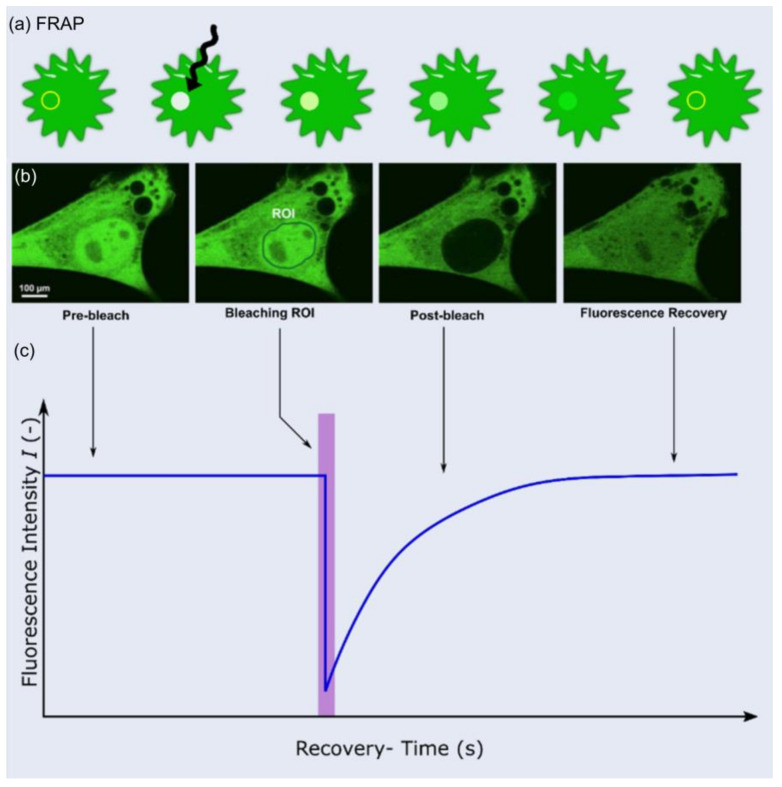
Figure 9.
(a) Schematic representation of FRAP method, (b) Example of a FRAP experiment (c) Anatomy of a typical FRAP curve. Modified and reprinted with permission from [123] under creative commons CC BY 4.0. Copyright © 2023 by the authors; licensee MDPI, Basel, Switzerland.

