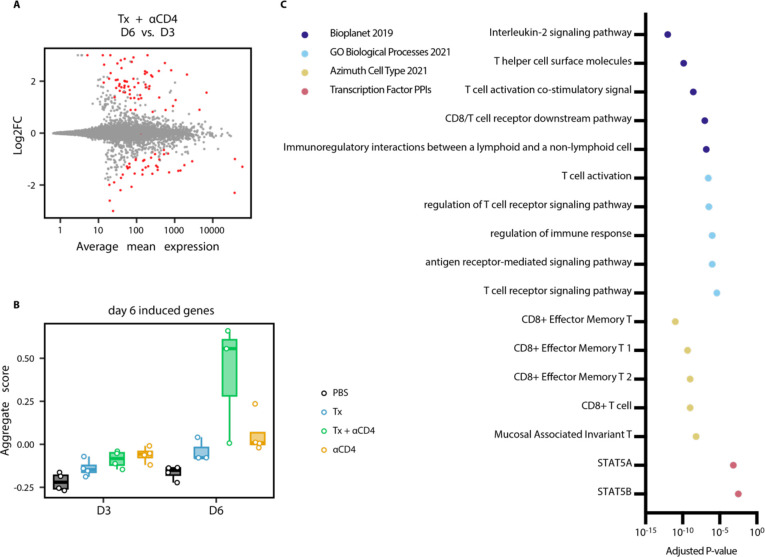
Figure 5. Tx + αCD4 associated with cytotoxic T cell signature in the tumor.
(A) Differential expression testing of Tx + αCD4 on day 3 vs. day 6 tumor samples relative to first α4-1BB-LAIR treatment, with statistically significant hits highlighted in red (FDR ≤ 5%). (B) Average expression level of significantly upregulated DEGs identified in (A) across all treatment groups. (C) Pathway enrichment analysis of upregulated DEGs identified in (A).

