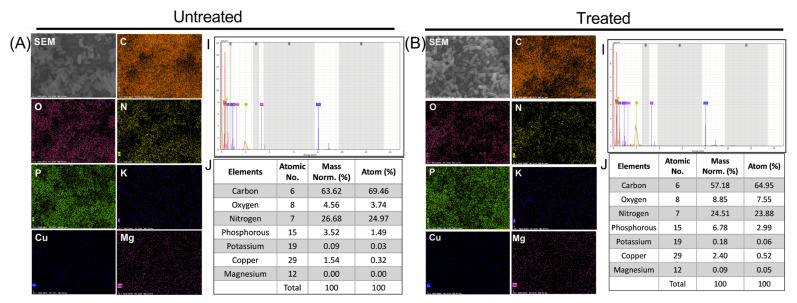
Figure 8.
EDS elemental mapping displayed the distribution of elements in the PG-NOW untreated (A) and treated samples (B) of the E. coli strain, which shows the SEM image of the bacterial structure together with carbon (C), oxygen (O), nitrogen (N), phosphorous (P), potassium (K), copper (Cu), and magnesium (Mg)and their spectra with mass percentage.

