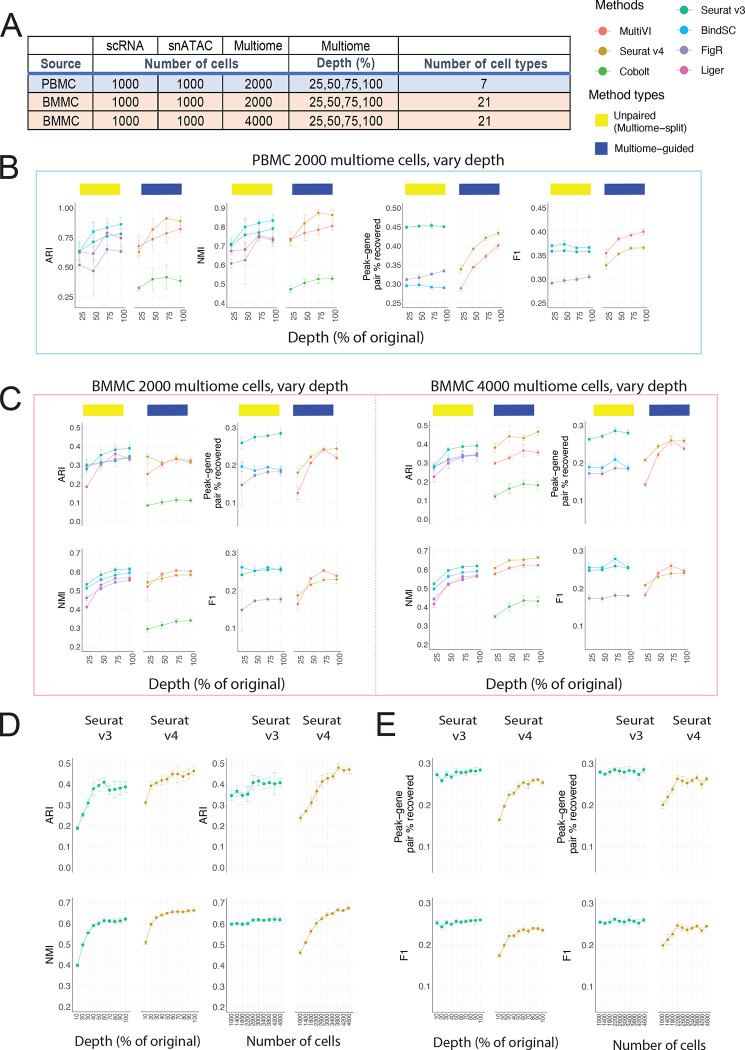
Figure 3:
Evaluation of integration performance at varying sequencing depth for multiome cells. (A) Details of the simulation scheme. (B – C) Performance of cell type annotation and peak-gene association recovery in the PBMC-based simulations (B) and BMMC-based simulations (C: left panel, 2,000 multiome cells; right panel, 4,000 multiome cells). ARI and NMI measures agreement between predicted cell type and ground-truth labels. Peak-gene pair % recovered is the percentage of peak-gene pairs correctly identified comparing to the ground-truth list calculated using 10,412 paired PBMC cells (B) and 6,740 BMMC cells (C). F1 is the prediction accuracy normalized by the number of false positives and false negatives. (D) Performance of cell type annotation using Seurat v3 or Seurat v4 at increasing depth or increasing number of cells. (E) Performance of peak-gene association recovery using Seurat v3 or Seurat v4 at increasing depth or increasing number of cells. For all subplots, error bar is mean ± standard deviation.

