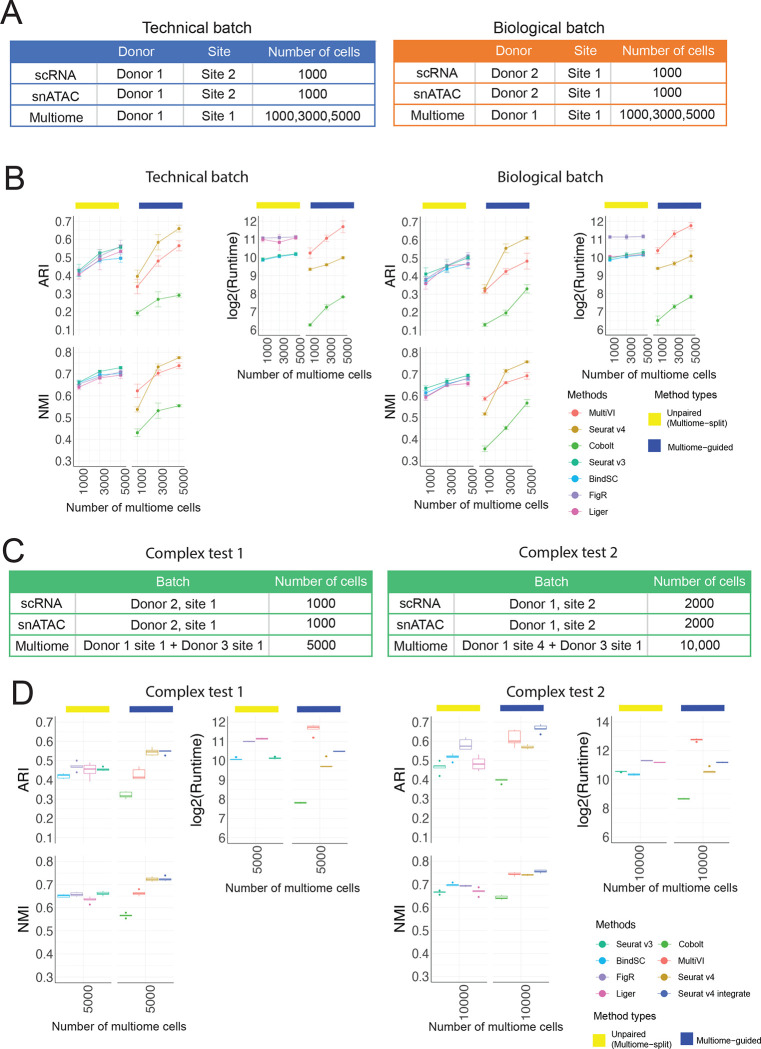
Figure 4:
Evaluation of integration performance in the presence of batch effects. (A) Simulation details for the constructed data with technical batches and biological batches. (B) Performance of cell type annotation and runtime in the presence of technical and biological batches shown in (A). ARI and NMI measure agreement between predicted cell type and ground-truth labels. Runtime is measured in seconds, for each method, in log2 scale. Error bar is mean ± standard deviation. (C) Simulation details for two datasets with more complex batch structures. (D) Performance of cell type annotation and runtime in the presence of technical and biological batches shown in (C). ARI and NMI measure agreement between predicted cell type and ground-truth labels. Runtime is measured in seconds, for each method, in log2 scale. Whisker is 1.5 times the inter-quartile range.

