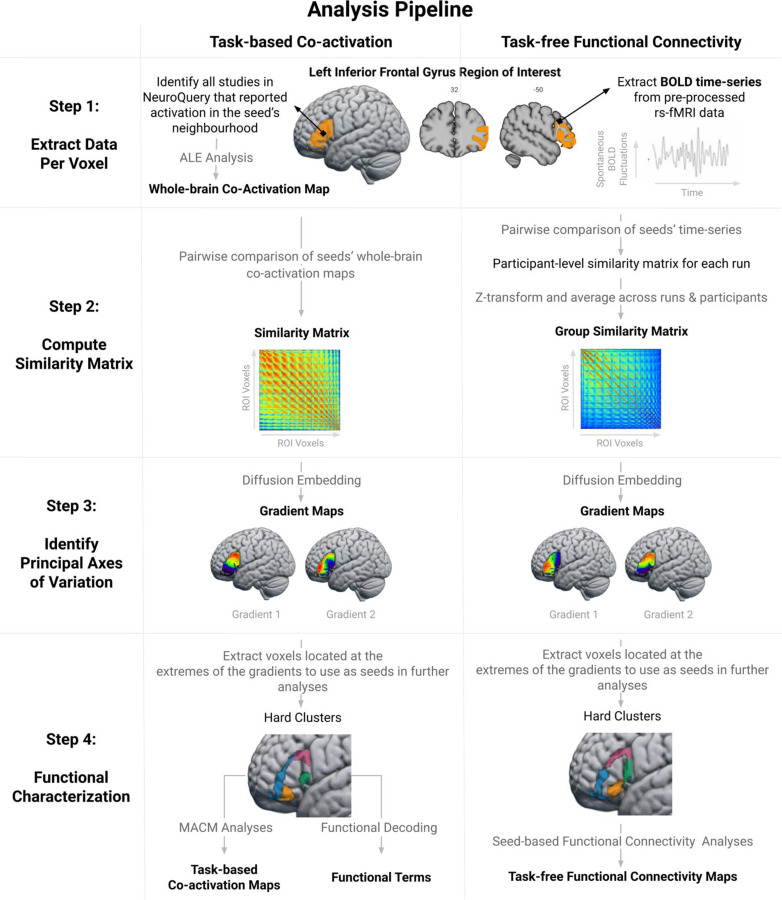
Figure 1.
Schematic overview of the analytic pipeline. The output of each analysis step is highlighted in bold. In the first step, we estimated the whole-brain co-activation patterns of individual ROI voxels using meta-analytic co-activation modelling (first column) and extracted their resting-state BOLD time-series (second column). Then, we performed a pairwise comparison of each voxel’s co-activation patterns/time-series using the product-moment correlation coefficient. This resulted in two similarity matrices, which were subsequently used as input for gradient analyses (diffusion embedding algorithm) in order to identify the main axes of variation across the ROI. In the final step, we performed MACM, functional decoding and seed-based resting-state FC analyses on hard clusters extracted from the edges of the gradient maps in order to identify the patterns of FC that characterize different IFG sub-regions. The code used for data analysis can be accessed at: osf.io/u2834/.

